“In her smash 2003 hit ‘White Flag’, it was Dido who declared she would go down with the ship rather than surrender her love but investors in tech stocks, meme stocks like GameStop, cryptocurrencies and momentum-driven investments such as the ARK Innovations Exchange-Traded Fund could be forgiven for thinking it may be time to head for the life rafts as the rout continues,” says AJ Bell Investment Director Russ Mould. “The latest catalyst for a loss of faith – even in perceived inflation hedges such as cryptos – is the minutes from the last meeting of the Federal Reserve, which clearly hint that interest rates could go higher and do so faster than expected and that even a shift to a withdrawal of Quantitative Easing could be on the cards in 2022.
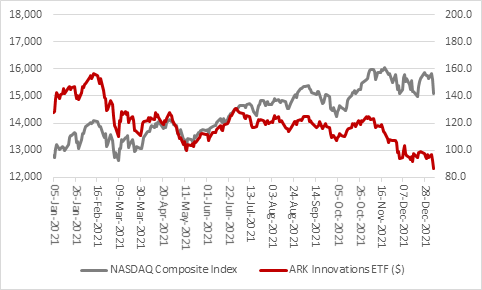
Source: Refinitiv data
“There are several possible explanations for why higher inflation and then tighter monetary policy could be bad news for technology stocks, Cathie Wood’s ARK Innovations ETF and the rest, but the link between the two trends make more sense than many expect.
1. The last decade has been characterised by low inflation, low growth and low interest rates. In that environment, long-duration assets, bonds and growth stocks (companies seen as capable of generating increases in sales, profits and cashflow almost whatever the weather) have been highly prized and performed strongly. If that environment is now changing, it would be logical to expect those assets to do less well. In theory, high inflation, faster (nominal) growth and higher interest rates would persuade investors to look at short-duration assets, such as commodities, cyclicals and ‘value’ stocks.
2. If inflation means there is plenty of growth around now – ‘jam today’ – then there is no need to pay high premium valuations for the ‘jam tomorrow’ offered by the disruptors that feature so heavily in ARK Innovations ETF and the NASDAQ Composite and the NASDQ 100 indices, because growth is no longer so scarce. This would again lead investors toward cyclical stocks like industrials, banks, oils and miners that have underperformed for years and trade on much lower valuations as a result, and lead them away from tech and biotech stocks which have outperformed and are highly valued as a result.
3. There is a more direct mathematical impact upon the valuations of growth stocks. Either because they do not make a profit now, or because the vast bulk of their profits and cashflows will be made much further out in the future, this type of company is often valued using a discounted cashflow model (DCF). Based upon assumptions concerning long-term growth rates, operating margins and capital investment needs, a DCF attempts to quantify how much cash a company will generate over ten, twenty or thirty years, or even its entire lifetime.
This aggregate future cashflow is then ‘discounted back’ using an assumed interest rate to generate the value of the future cash in today’s money. This sum is known as the net present value (NPV) and, once adjusted for any cash and debt on the balance sheet, represents the theoretical value of the company and its equity.
Quite simply, the lower the discount rate used, the greater the NPV of future cashflows, which is why long-term growth stocks have thrived over the last ten years (when interest rates have effectively been near zero).
However, the opposite is now starting to apply: higher interest rates mean a lower NPV as the value of the future cashflow is discounted back more aggressively.
“Investors may argue that the fears of a tech meltdown are overdone. After all, the NASDAQ Composite is still only 6% below its all-time peak of 2021. It is still 18% higher than it was a year ago, for good measure.
“But you can argue that appearances are deceptive. Of the 3,522 NASDAQ Composite members to have been trading for the whole of the past year, only 1,716 have gained more than 1% - that is 49% - while 1,802 (or 51%) have fallen by more than 1%.
“That suggests breadth is not all it could be and that the NASDAQ’s gains are starting to rely on a smaller group of stocks. This is all well and good if they keep powering higher but can lead to trouble if they start to crack for any reason and while consensus analysts’ forecasts have the NASDAQ 100’s ten-best performers of the past 12 months making a combined net profit of $110 billion in the coming year, their aggregate market cap is $3.2 trillion.
“As a result, they trade on a forward price/earnings ratio of 29.1 times (and a market cap to sales ratio of nearly eight times).
Valuations of top ten performers in NASDAQ 100 over the past 12 months
|
|
|
$ billion |
$ billion |
$ billion |
|
|
Share price change |
|
2022E |
2022E |
|
|
last 12 months |
Market cap |
Sales |
Net profit |
|
Lucid |
267.0% |
60.4 |
2.1 |
(1.9) |
|
Fortinet |
114.0% |
49.6 |
4.0 |
0.7 |
|
NVIDIA |
106.0% |
690.0 |
31.5 |
10.8 |
|
Moderna |
97.1% |
87.3 |
20.8 |
11.3 |
|
Marvell Technology |
76.7% |
71.0 |
5.9 |
0.5 |
|
Applied Materials |
71.6% |
137.0 |
26.5 |
7.1 |
|
Intuit |
61.0% |
168.0 |
12.3 |
2.0 |
|
Alphabet |
58.4% |
1,828.0 |
297.8 |
75.9 |
|
KLA-Tencor |
58.3% |
63.8 |
9.2 |
3.5 |
|
Datadog |
58.1% |
45.4 |
1.4 |
(0.0) |
|
|
|
|
|
|
|
TOTAL |
|
3,200.5 |
411.5 |
109.9 |
|
|
|
|
|
|
|
Market cap / sales |
|
|
7.8 x |
|
|
Market cap / earnings |
|
|
|
29.1 x |
Source: Sharepad, Marketscreener, Zack's, NASDAQ, consensus analysts' forecasts
“Such premium ratings price in a lot of good news and not a lot of bad, so in theory it will take a lot to provide upside surprises and not much to generate the sort of negative surprises that could have investors running for cover.
“Ultimately the valuation paid to access a firm’s cash flow (assuming there is any) is the ultimate arbiter of investment return – the higher the valuation you pay, the lower the return you get, over the long term, and the less downside protection you have. It is not for nothing that Gordon Gekko, the insider-trading arch-villain of Oliver Stone’s 1987 cult film ‘Wall Street; tersely mutters that ‘the mother of all evil is speculation
“Worryingly, the worst ten performers in the NASDAQ 100 still don’t offer much downside protection, owing to their lofty valuations, lack of profit and lack of cash flow.
“These stocks are still trading on a lot of hope and not much substance, even after some crashing falls in the past year.
“Even with the benefit of the profits of three Chinese internet giants (who now have their own regulatory and profit worries), the NASDAQ 100’s worst ten performers over the last year still trade on six times sales and more than 200 times earnings. There’s not much downside protection there if anything goes wrong (either specifically at the companies or more generally across financial markets).
Valuations of worst ten performers in NASDAQ 100 over the past 12 months
|
|
|
$ billion |
$ billion |
$ billion |
|
|
Share price change |
|
2022E |
2022E |
|
|
last 12 months |
Market cap |
Sales |
Net profit |
|
Okta |
(20.4%) |
30.9 |
1.8 |
(0.8) |
|
Activision Blizzard |
(26.9%) |
51.6 |
9.1 |
2.7 |
|
MercadoLibre |
(31.5%) |
57.0 |
9.4 |
0.3 |
|
Splunk |
(32.7%) |
17.8 |
3.0 |
(1.4) |
|
Baidu |
(32.8%) |
319.0 |
21.9 |
2.3 |
|
JD.com |
(34.0%) |
623.0 |
182.5 |
2.2 |
|
DocuSign |
(36.9%) |
28.5 |
2.6 |
(0.0) |
|
Zoom Video Communications |
(51.5%) |
52.1 |
4.7 |
0.9 |
|
Pinduoduo |
(74.1%) |
387.0 |
20.7 |
1.3 |
|
Peloton Interactive |
(78.3%) |
10.6 |
4.4 |
(0.8) |
|
|
|
|
|
|
|
TOTAL |
|
1,577.5 |
260.2 |
6.6 |
|
|
|
|
|
|
|
Market cap / sales |
|
|
6.1 x |
|
|
Market cap / earnings |
|
|
|
239.0 x |
Source: Sharepad, Marketscreener, Zack's, NASDAQ, consensus analysts' forecasts
“The valuations across the ten largest holdings of Cathie Wood’s ARK Innovations ETF are barely less extreme.
“This is not to knock Cathie Wood. But not all investment styles can work all of the time and if the environment does change from low inflation, low growth, low rates to high inflation, high growth, high rates on a sustainable basis then these stocks – and this investment product – could be in trouble. If the environment does not change, and deflation or disinflation remain the key to the backdrop, and central banks quickly return to cutting rates, these sorts of companies could yet come back into fashion.”
Valuations of ten largest holdings in ARK Therapeutics ETF
|
|
|
$ billion |
$ billion |
$ billion |
|
|
Share price change |
|
2022E |
2022E |
|
|
last 12 months |
Market cap |
Sales |
Net profit |
|
Tesla |
48.0% |
1,095.0 |
72.6 |
8.7 |
|
Teladoc |
(58.5%) |
13.5 |
2.6 |
(0.3) |
|
Roku |
(42.6%) |
26.4 |
3.8 |
0.2 |
|
Coinbase |
(28.7%) |
50.4 |
7.2 |
1.6 |
|
Unity Software |
(12.3%) |
35.4 |
1.4 |
(0.5) |
|
Zoom Video Communications |
(51.5%) |
52.1 |
4.7 |
0.9 |
|
Block |
(36.8%) |
66.2 |
18.8 |
0.3 |
|
Spotify |
(17.5%) |
38.6 |
11.5 |
0.1 |
|
Shopify |
8.8% |
149.0 |
6.1 |
0.4 |
|
Twilio |
(28.7%) |
41.9 |
3.7 |
(1.0) |
|
|
|
|
|
|
|
TOTAL |
|
1,568.5 |
132.4 |
10.4 |
|
|
|
|
|
|
|
Market cap / sales |
|
|
11.8 x |
|
|
Market cap / earnings |
|
|
|
150.8 x |
Source: ARK Innovations ETF factsheet, Marketscreener, Zack's, NASDAQ, consensus analysts' forecasts
