“The Democrats have got their wish and the House of Representatives has passed two motions of impeachment against President Trump. Whether either the US electorate is likely to care remains unclear but based on the two impeachment episodes of modern times financial markets are likely to remain unruffled – especially as the Republican majority in the Senate is going to deny the Democrats the 67% vote that they need in the Upper House to remove Trump from office,” says Russ Mould, AJ Bell Investment Director.
“Looking at this political event through the narrow prism of financial markets, there are two precedents.
• The Republican Richard Nixon resigned in the second year of his second term in August 1974, after the impeachment process had begun in February of that year and received judicial approval on three counts in July, following the Watergate scandal. The US stock market, as benchmarked by the S&P 500, fell consistently as Watergate unravelled Nixon’s Presidency and the index only bottomed two months after his departure.
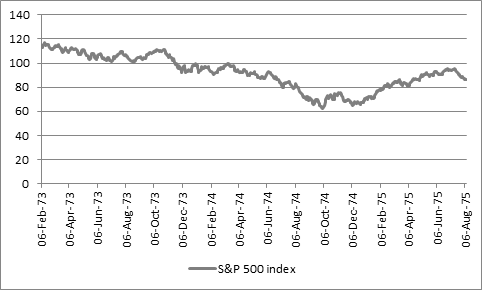
Source: Refinitiv data, from one year before Nixon's impeachment (on 6 Feb 1974) to one year after his resignation (on 9 Aug 1974)
• The Democrat Bill Clinton was impeached in December 1998 on two counts but acquitted by the Senate in February 1999. In a stark contrast to the Nixon era, the US stock market sailed on regardless as Clinton became entangled in the so-called Monica Lewinsky affair and it picked up speed once he was acquitted of perjury and obstruction of justice.
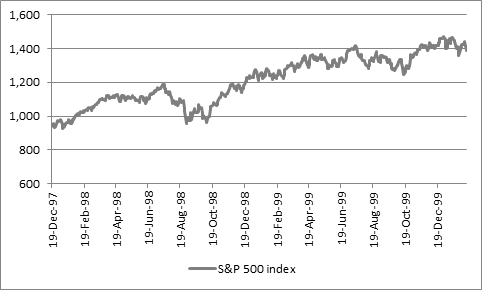
Source: Thomson Reuters Datastream - from one year before Clinton's impeachment (on 19 Dec 1998) to one year after his acquittal (on 12 Feb 1999)
“However, it would be far too simplistic to assume that politics alone set the tone for markets on either occasion.
• During Nixon’s second term, the US lurched into recession after the 1973 oil price shock, as inflation rocketed and the US Federal Reserve began to jack up interest rates in response, creating a terrible environment for stocks.
• Under Clinton, the picture could hardly have been different – even allowing for the 1997-98 Asian currency and emerging market debt crisis which ultimately brought down the Long Term Capital Management hedge fund and forced the Federal Reserve to cut interest rates and step in with a bail-out. The economy buzzed along with annual growth rates of more than 4%, inflation was benign at around 2%, oil was falling sharply (putting money in consumers’ pockets) and the markets were perceived to have the backing of the ‘Greenspan put,’ whereby the Fed would act if stocks began to wobble.
“If anything is going to derail the longest-running bull market in US history, the Democrats’ impeachment of President Trump is unlikely to be it.
|
US equity bull markets since 1945 |
|||||
|
Start |
Finish |
Duration (days) |
Start |
Finish |
Gain |
|
03-Jan-50 |
03-Aug-56 |
2,404 |
17 |
50 |
294.1% |
|
22-Oct-57 |
13-Dec-61 |
1,513 |
39 |
73 |
187.2% |
|
26-Jun-62 |
14-Feb-66 |
1,329 |
52 |
94 |
180.8% |
|
07-Oct-66 |
29-Nov-68 |
784 |
73 |
108 |
147.9% |
|
26-May-70 |
11-Jan-73 |
961 |
69 |
120 |
173.9% |
|
04-Oct-74 |
28-Nov-80 |
2,247 |
62 |
141 |
227.4% |
|
12-Aug-82 |
25-Aug-87 |
1,839 |
102 |
337 |
330.4% |
|
19-Oct-87 |
16-Jul-90 |
1,001 |
225 |
369 |
164.0% |
|
11-Oct-90 |
24-Mar-00 |
3,452 |
295 |
1,527 |
517.6% |
|
09-Oct-02 |
09-Oct-07 |
1,826 |
777 |
1,565 |
201.4% |
|
09-Mar-09 |
19-Dec-19 |
3,937 |
677 |
3,191 |
471.3% |
|
Average |
|
1,736 |
|
|
289.6% |
Source: Refinitiv data
“That said, one historical quirk to note is how relatively poorly the US equity market fares in the fourth year of a Republican Presidential term, which since 1945 has provided the worst annual return on average of any single year under any Presidency from either party.
“As benchmarked by the Dow Jones, the US stock market has, on average, done better under the Democrats anyway (thanks to the monster bull runs enjoyed during the two-term Presidencies of Bill Clinton and Barack Obama and the market’s feeble efforts under Nixon and George W. Bush). But the single worst year for the benchmark is, on average, the final year of a Republican Presidency.
|
Election |
President |
Party |
Year 1 |
Year 2 |
Year 3 |
Year 4 |
Term |
|
|
|
|
|
|
|
|
|
|
1948 |
Harry S. Truman |
Democrat |
12.9% |
17.5% |
14.5% |
8.4% |
64.6% |
|
1952 |
Dwight D. Eisenhower |
Republican |
(3.8%) |
44.0% |
20.8% |
2.3% |
71.1% |
|
1956 |
Dwight D. Eisenhower |
Republican |
(12.8%) |
34.0% |
16.4% |
(9.3%) |
23.3% |
|
1960 |
John F. Kennedy * |
Democrat |
18.7% |
(10.8%) |
17.0% |
14.6% |
41.9% |
|
1964 |
Lyndon B. Johnson |
Democrat |
10.9% |
(18.9%) |
15.2% |
4.3% |
8.0% |
|
1968 |
Richard M. Nixon |
Republican |
(15.2%) |
4.8% |
6.1% |
14.6% |
8.1% |
|
1972 |
Richard M. Nixon ** |
Republican |
(16.6%) |
(27.6%) |
38.3% |
17.9% |
(1.5%) |
|
1976 |
Jimmy Carter |
Democrat |
(17.3%) |
(3.1%) |
4.2% |
14.9% |
(4.0%) |
|
1980 |
Ronald Reagan |
Republican |
(9.2%) |
19.6% |
20.3% |
(3.7%) |
25.7% |
|
1984 |
Ronald Reagan |
Republican |
27.7% |
22.6% |
2.3% |
11.8% |
79.0% |
|
1988 |
George H. W. Bush |
Republican |
27.0% |
(4.3%) |
20.3% |
4.2% |
52.2% |
|
1992 |
Bill Clinton |
Democrat |
13.7% |
2.1% |
33.5% |
26.0% |
95.3% |
|
1996 |
Bill Clinton |
Democrat |
22.6% |
16.1% |
25.2% |
(6.2%) |
67.3% |
|
2000 |
George W. Bush |
Republican |
(7.1%) |
(16.8%) |
25.3% |
3.1% |
(0.0%) |
|
2004 |
George W. Bush |
Republican |
(0.6%) |
16.3% |
6.4% |
(33.1%) |
(17.7%) |
|
2008 |
Barack Obama |
Democrat |
17.5% |
11.0% |
5.5% |
7.3% |
47.6% |
|
2012 |
Barack Obama |
Democrat |
26.5% |
7.5% |
(2.2%) |
13.4% |
50.8% |
|
2016 |
Donald J. Trump |
Republican |
25.1% |
(5.6%) |
21.1% |
|
42.9% |
|
|
|
|
|
|
|
|
|
|
Average |
6.7% |
6.0% |
16.1% |
5.3% |
38.2% |
||
|
Average - Democrat |
13.2% |
2.7% |
14.1% |
10.3% |
46.4% |
||
|
Average - Republican |
1.4% |
8.7% |
17.7% |
0.9% |
26.7% |
||
Source: Refinitiv data. Calendar year. Based on the Dow Jones Industrials. Trump’s third year runs to 18 December 2019. *John F. Kennedy assassinated in November 1963 and replaced by Lyndon B. Johnson. ** Richard M. Nixon resigned August 1974 and replaced by Gerald R. Ford.
“But those differing performances owed as much if not more to monetary policy and the macroeconomic background, as well as the fundamentals of valuation and corporate earnings growth, as they did Presidential policy.
“This explains Warren Buffett’s pithy comment that ‘In the twentieth century, the United States endured two world wars and other traumatic and expensive military conflicts; the Depression; a dozen or so recessions and financial panics; oil shocks; a flu epidemic; and the resignation of a disgraced President. Yet the Dow rose from 66 to 11,497.”
“Bearing that, and the data, in mind, investors may better off looking at these issues again and doing their best to ignore any political shenanigans altogether.
“On the plus side, US economy is doing relatively well and monetary and fiscal policy are very accommodative.
“On the downside, valuations look rich, not least because stocks have gained more than 20% in 2019 while earnings have flat-lined and debt levels are high across government, corporates and consumers.
“It still feels like a brave investor who will bet against this bull run becoming not only the longest but the most rewarding – the S&P 500 needs to rise by 10% to 3,505 to exceed the 1990-2000 gain of 518% - but then markets are often at their most dangerous when making money looks easiest.”
