• New research from AJ Bell shows how much damage loose monetary policy has done to the returns from Cash ISAs over the last ten years:
£10,000 held in the average cash ISA over the last ten years would now be worth £9,772 after adjusting for inflation
A saver using their entire Cash ISA allowance each year since 2011 would have seen £127,320 turned into £124,857 in real terms
The same amount placed into the average global stock market fund would now be worth £196,079 in real terms
All Investment Association fund sectors beat the average cash ISA, apart from the two moneymarket sectors
Absolute return fund returns have been disappointing, partly a result of low interest rates
Technology and US funds have done well, again low interest rates play their part
• Next Thursday, the Bank of England interest rate committee meets for the first time since the current national lockdown was introduced, and they will be weighing up the possibility of negative interest rates.
Laith Khalaf, financial analyst at AJ Bell, comments:
“It’s been a lost decade for cash savers, who have had to watch the money stashed in the typical Cash ISA gradually lose its buying power. While inflation has been mercifully low, it’s still beaten the interest rate paid on the average Cash ISA since 2011, thanks to monetary austerity.
“By contrast, investors in Stocks and Shares ISAs have generally had a good ten years. There has been a high degree of variation in performance across markets, with technology funds and US funds sitting atop the fund league table. But even amongst the most popular funds with stocks and shares ISA investors ten years ago, returns have been significantly higher than both cash and inflation.
“Over ten years it’s entirely normal to expect stock market returns to beat cash. That is the extra reward stock market investors get for taking risk with their capital and enduring its fluctuations. However, undoubtedly the last ten years have shown an extreme divergence between the fortunes of cash savers and stock market investors, because loose monetary policy has simultaneously depressed cash interest rates and boosted asset prices, in particular shares and bonds, which form the bedrock of most Stocks and Shares ISA funds.
“Today, remarkably, base rate is even lower than it was ten years ago, and the Bank of England is considering whether to cut it further, possibly taking it into negative territory for the first time. Despite that, money continues to accumulate in cash accounts thanks to lockdown decimating spending options. But the issue of high levels of cash predates the pandemic, as the FCA highlighted in December. Their consumer research, which took place before the COVID crisis, found that around 6 million UK adults had investable assets of £10,000 or more, which were all held in cash. A further 3 million or so had more than three quarters of their assets in cash. The FCA said:
“Many consumers are still holding money in cash that could be invested to provide potentially higher returns, but they have not sought or received the help with their finances that would help them to make better investment decisions.”(Evaluation of the impact of the RDR and FAMR, Dec 2020)
“While there is some speculation that monetary and fiscal stimulus will lead to inflation and rates will have to rise, if the last ten years have taught us anything, it’s that interest rates can stay lower than you think, for longer than you expect. For savers and investors, speculating over the course of future rates isn’t what should be driving decisions in the here and now. The question of whether to save in cash or invest in the stock market is actually relatively straightforward, it simply comes down to thinking about your finances in terms of short, medium, and long term pots.
“For money that you might need in five years or less, cash is likely to be the main focus. For money that you might need in five to ten years, you could consider putting at least some of it in the stock market. For money that you won’t need for ten years or more, you might consider investing a higher proportion, or even all of it, in the stock market. Savers may of course choose to take a more conservative approach by holding higher levels of cash, but they should be comfortable that in the long run, this extra caution will likely come at a price.”
Cash ISA and Stocks & Shares ISA returns
Since January 2011, the average interest rate paid on cash balances has sunk from 2.2% to 0.4%, a joint record low, according to Bank of England data. Rates have been depressed by the central bank cutting base rate of course, but also the Funding for Lending scheme and The Term Funding scheme, which have given banks access to cheap capital, so they are less reliant on depositors such as ISA savers.
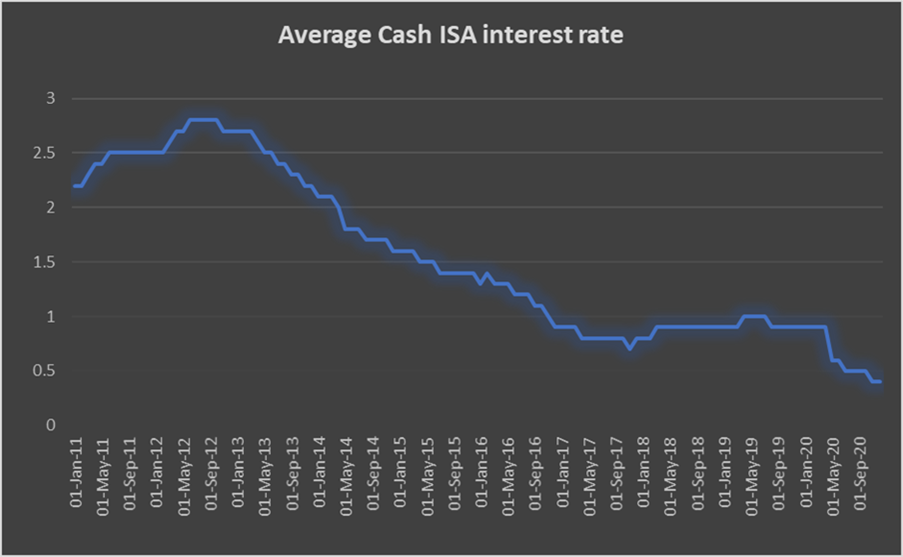
Source: Bank of England
£10,000 held in a cash ISA in 2010 would now be worth £11,658, based on average rates paid over the period. But after inflation is taken into account, that £10,000 would actually be worth just £9,772. In other words, its buying power has actually gone backwards, to the tune of £228, or 2.3%.
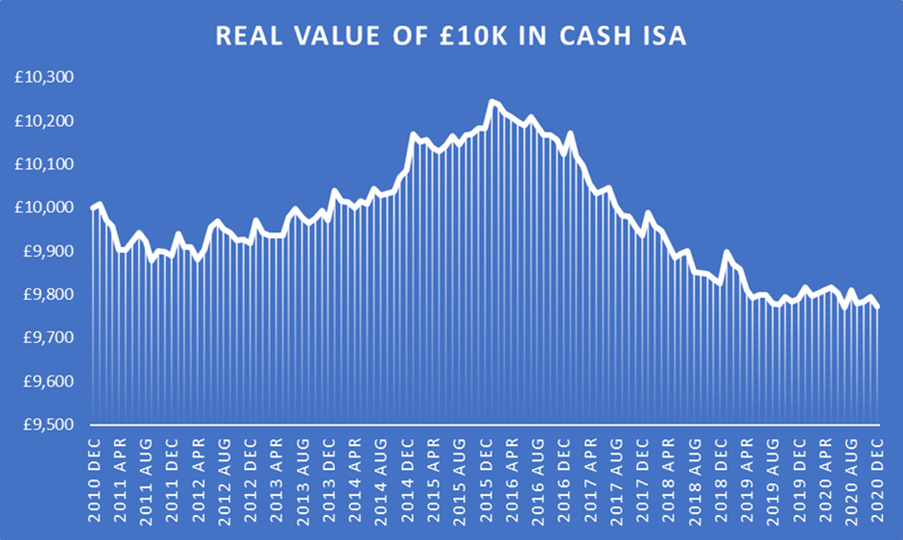
Sources: Bank of England, ONS CPIH inflation
A saver who put all of their annual allowance into a Cash ISA each January from 2011 to 2020, would have seen the £127,320 they saved turned into £133,037. However once inflation is taken into account, the real amount falls back to £124,857, a loss in buying power of £2,463. The same amount placed into the average global stock market fund in a Stocks and Shares ISA would be worth £210,891 by now, or £196,079 after inflation is taken into account. That’s a real increase of £68,759. (Figures based on CPIH inflation published by the ONS).
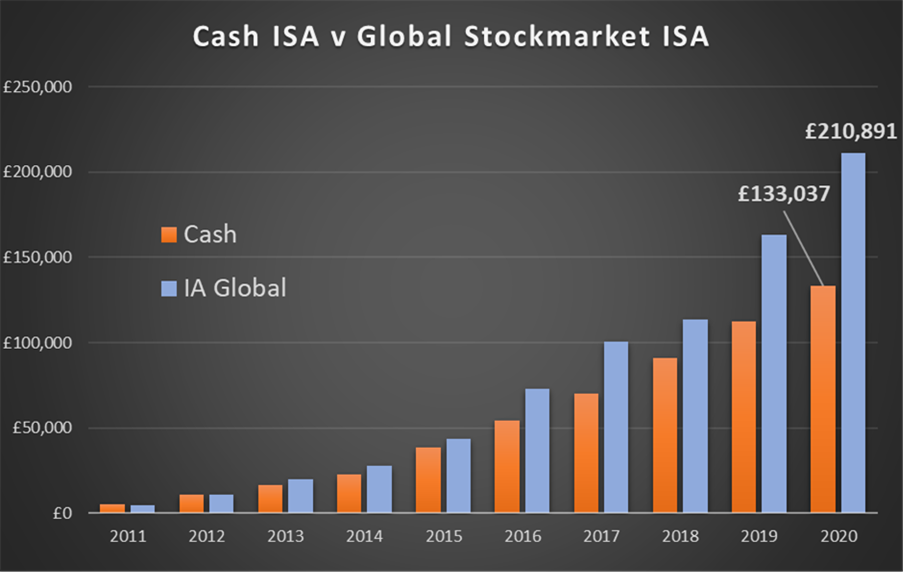
Sources: Bank of England, FE Total Return in GBP for the IA Global sector
Looking across all open-ended funds available in a stocks and shares ISA, every sector has on average beaten the returns available from the average Cash ISA over the last ten years, apart from the two cash-like money market sectors. Indeed the five most popular sectors with stocks and shares ISA investors in 2011 have significantly outperformed the average Cash ISA, posting an average 10 year return of 87.8%, compared to 16.6% from cash. The average of all the fund sectors has returned 100% over the last ten years, equivalent to doubling your initial investment.
Technology funds and US funds have performed the best, thanks to the rising dominance of the powerhouse FAANGM stocks, and to low interest rates, which have increased the present value of the future income streams many tech firms are prized for. The Absolute Return sector has been a notable laggard in the pack. While it has beaten the average Cash ISA and inflation, it’s not by much. Many of the funds in this sector use shorting strategies, which benefit from a tailwind of interest paid on the cash acquired by selling shares short. Of course, in an era of ultra low interest rates, that tailwind has dwindled to little more than a faltering waft, leaving the investment strategy employed by the fund manager to do all the heavy lifting. As the figures below show, on average such strategies have been disappointing, to say the least.
|
10 year total return/ % |
£10,000 invested |
|
|
AVERAGE CASH ISA |
16.6 |
£11,658 |
|
CPIH inflation |
19.3 |
£11,930 |
|
Average of all fund sectors |
100 |
£20,000 |
|
Best 5 investment sectors |
||
|
IA Technology & Telecommunications |
381.6 |
£48,160 |
|
IA North America |
244.4 |
£34,436 |
|
IA North American Smaller Companies |
252.3 |
£35,227 |
|
IA Japanese Smaller Companies |
220.1 |
£32,011 |
|
IA UK Smaller Companies |
179.9 |
£27,987 |
|
Worst 5 investment sectors |
||
|
IA Specialist |
41.5 |
£14,145 |
|
IA Targeted Absolute Return |
24.3 |
£12,427 |
|
IA Global EM Bonds Local Currency |
19.8 |
£11,981 |
|
IA Standard Money Market |
3.0 |
£10,303 |
|
IA Short Term Money Market |
1.8 |
£10,184 |
|
5 most popular ISA sectors in Jan 2011 |
||
|
IA UK All Companies |
83.6 |
£18,363 |
|
IA UK Equity Income |
76.4 |
£17,642 |
|
IA Sterling Corporate Bond |
71.9 |
£17,190 |
|
IA Global |
147.7 |
£24,769 |
|
IA Mixed Investment 20 to 60% Shares |
59.5 |
£15,948 |
|
Average |
87.8 |
£18,782 |
Sources: Bank of England, ONS, Investment Association, FE Total Return in GBP 31/12/2010 to 31/12/2020