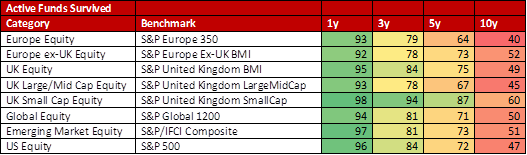
• Only one in two sterling-denominated funds have survived the last 10 years, according to latest figures from S&P
• Very few active managers have beaten the benchmark over the long term
• Older funds are charging almost 50% more than newer funds, AJ Bell research reveals
Matt Brennan, head of investment management at AJ Bell, comments:
“First published in 2002, S&P have been producing what it calls the SPIVA (S&P Index Versus Active) scorecard for nearly two decades. It’s a quantitative review of how active managers have performed across various time periods against a relevant S&P benchmark. The headline statistics from the latest March 2022 report show that very few active managers outperform the benchmark when measured over long time periods, with more variable results over shorter time periods, or for more niche asset classes.
“Like any statistics produced in a report, these can be used by the user to confirm their view – for a rules-based investor it confirms their belief that markets are efficient, and it’s hard for an active manager to add value consistently. On the other hand, for those in the active management camp, it shows that although picking the winning managers may be hard, good managers do exist, especially in less certain areas such as UK small cap and emerging markets.
“However, beyond the active vs passive debate, one startling statistic jumps out. Of the funds in existence on 1 January 2012, only one in two of them are still going. This is staggering, given most funds tell investors they should invest in them for at least five years. Not all funds will have disappeared altogether, with several of them merging into other funds, however as an investor in an active fund, the question perhaps shouldn’t be ‘will this fund beat the benchmark’, but rather ‘will it still exist in the long term?”
% of active funds surviving over various time frames
AJ Bell’s further analysis
“S&P use the Morningstar categories to determine the relevant sector for each fund as follows:

Source: S&P, Morningstar, December 2021
“We have rebuilt these sectors ourselves to drive further analysis of the funds that have survived. Based on the criteria of sterling-denominated, open-ended active funds within these sectors, 640 funds have a 10-year performance track record. Of these 640 funds, the average assets under management for each fund was £725 million when each fund last reported data. On the other hand, 1,056 funds are in the Morningstar sectors with less than 10 years’ performance corresponding to the SPIVA categories. It is no surprise that the average asset size of these funds is significantly smaller at £510 million, or to put it another way, 30% lower.
“What is perhaps surprising, given the regulator’s drive to ensure benefits of scale are passed on to investors, is that the average ongoing cost of funds with a 10-year track record is almost 50% higher than the group with less than a 10-year track record, sitting at 1.38%, compared to 0.93% for the newer funds. The following graph shows the trend between the age of a fund and the fees it charges.
Fund age v management fee
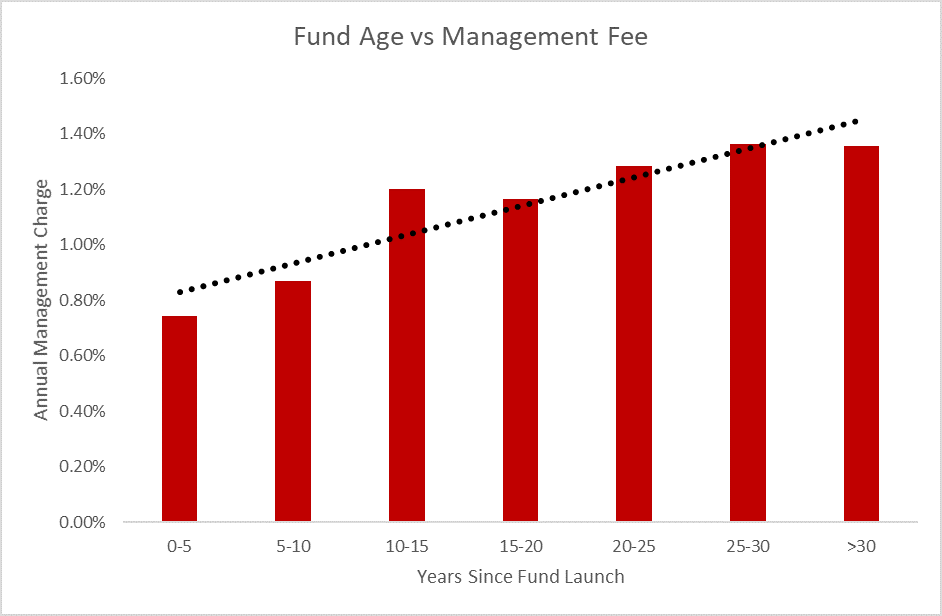
Source: Morningstar, AJ Bell, March 2022
“This shows that despite being larger in size, a fund with a long, successful track record can charge a premium for its management, despite the fact they are operating larger funds on average. Or a less generous interpretation would be that older funds which have built a large investor base are sitting on their laurels, and letting inertia take its course. On the flip side of the coin, newer funds need to offer lower costs to be competitive against incumbents, and to compete against passive funds. These dynamics perhaps point to why there hasn’t been as much of a squeeze on active fund management fees as many expected.”