“One of the most striking features of the stock market on both sides of the Atlantic in the past 12 months is the way in which large-cap stocks are handily outperforming small-cap ones. Some will see this as a positive sign, the next leg in the bull market as structural winners continue to impress and laggards catch up,” says AJ Bell Investment Director Russ Mould. “Others will see it as a warning, as the first sign of waning risk appetite and a circling of the wagons against dangers such as inflation, perceived or real, or even a worrying repeat of the rise of the Nifty Fifty in the USA as investors crowd into a select list of names and drive them to ultimately unsustainable levels.
|
|
|
UK |
|
|
|
|
Change last 12 months |
|
|
Change in 2022* |
|
FTSE 100 |
16.30% |
|
FTSE 100 |
2.70% |
|
FTSE All-Share |
14.90% |
|
FTSE All-Share |
1.20% |
|
FTSE Small Cap |
-4.10% |
|
FTSE Small Cap |
-3.00% |
|
FTSE 250 |
-6.60% |
|
FTSE 250 |
-4.80% |
|
FTSE Aim All-Share |
-10.00% |
|
FTSE Aim All-Share |
-9.00% |
|
|
|
|
|
|
|
|
|
USA |
|
|
|
|
Change last 12 months |
|
|
Change in 2022* |
|
S&P 500 |
18.80% |
|
Dow Jones Industrials |
-2.60% |
|
Dow Jones Industrials |
15.40% |
|
S&P 500 |
-4.60% |
|
Wilshire 5000 |
15.20% |
|
Wilshire 5000 |
-5.70% |
|
NASDAQ Composite |
5.40% |
|
NASDAQ Composite |
-8.30% |
|
Russell 2000 |
-4.70% |
|
Russell 2000 |
-9.80% |
Source: Refinitiv data. *2022 data to the close on 1 February
“In the UK, the large caps of the FTSE 100 are starting to lead the way, while in the USA the 30-stock Dow Jones Industrials is the best performing index in 2022 as the Russell 2000 continues to lag. The small-cap Russell benchmark even briefly dipped into bear market territory in late January after a rapid 20% dip from its November peak.
“Small-caps are riskier than large-caps. They tend to offer a narrower range of goods and services and have a lesser geographic reach, relative to large caps. They are also often earlier in their development cycle, potentially less well financed and more reliant upon a key executive or entrepreneur, so the scope for something going wrong is greater and the downside protection less.
“They may also be less well placed to handle a sustained bout of inflation as smaller firms have to battle with larger suppliers, customers, or both, and they may have more scale, and therefore clout, when it comes to those all-important pricing discussions.
“Equally many of these facets mean small caps can outperform when things go well, the economy and financial markets and running hot and investors are prepared to embrace these risks.
“Yet right now investors seem to be shunning these risks.
“This may partially reflect the risk posed to small-caps’ profits by higher input and freight and wage costs, if they cannot pass them on.
“It may partially reflect a move away from secular, long-term growth plays to near-term, cyclical value plays (many of whom will be more mature firms by very dint of their size and age).
“And it may even a reflect a wider loss of risk appetite as central banks talk a tougher (or at least less accommodative) game and threaten to take away some of the cheap liquidity which has helped to fuel gains across financial markets for the last decade and beyond.
“That could all mean that small-cap weakness is a sign of wider trouble ahead, especially if they falter as large caps keep rising.
“The relative showing of small caps relative to big caps can be seen by simply dividing the value of the FTSE 100 index by the FTSE Aim All Share benchmark. If the score (and line on the chart) goes up, then large caps are outperforming, and vice-versa. This can be compared to a wider benchmark, such as the FTSE All-Share, to see if shifts in relative momentum have any implications for overall portfolio returns from UK equities.
“Marked outperformance by large-caps was a sign of wider distress ahead in 2000 and 2007-08 although steadier relative gains over small caps did not stop markets overall from progressing in the late 1990s, 2004-06 or 2011-16. A five year-run out outperformance by small-caps does appear to have ended in the UK though.
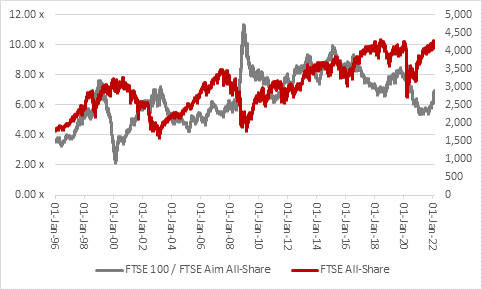
Source: Refinitiv data
“The same maths calculation can be made, and chart drawn, for US equities, using the Dow Jones Industrials as the large-cap proxy, the Russell 2000 for small-caps and the S&P 500 for the wider US market.
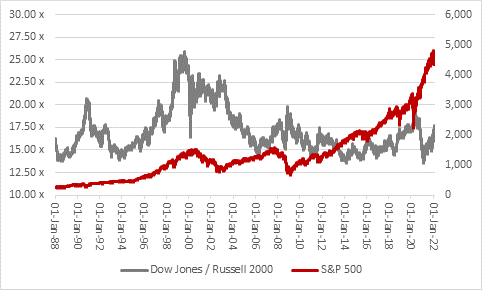
Source: Refinitiv data
“The US bear markets of 1990, 2000-02, 2007-09 and 2020 all featured a strong element of large-cap outperformance and again it does seem as if US small caps stopped leading the charge to make way for the bigger names in 2021. Again, this is not necessarily a harbinger of a wider market dislocation, but it does at least suggest there is a change in mood.”
