Buoyed by hopes for growth-stimulating tax reform and ongoing faith in the US Federal Reserve’s ability to provide plenty of cheap money, the Dow Jones Industrials is bearing down on the 24,000 mark for the first time, the S&P 500 on 2,650 and the NASDAQ on 7,000.
Russ Mould, investment director at AJ Bell looks at three charts that can help investors assess the health of the US market:
“America’s financial markets continue to write nearly as many headlines as its President. However, market cap-to-GDP and Professor Robert Shiller’s Cyclically Adjusted Price/Earnings (CAPE) ratios both suggest the US stock market has only ever been similarly or more expensive two or three times in its history (1929, 1999, 2007).
“All of those episodes ended with a bang rather than a whimper so investors need to be on their guard, despite or indeed maybe because of the prevailing optimism.
“Looking at the US market from a top-down perspective, there are three quick tests they can use to see whether the Trump trade is still hot to trot or primed to become a portfolio turkey. Based on the past 20 years performance data when these indices are doing well the Dow Jones Industrials will do well and when they are doing badly the broader US stock market will do badly.
1. The Russell 2000. “This is America’s main small-cap index. Small-caps can be a good guide to economic activity, since they tend to be more focused on their domestic market, and also market risk appetite, since up-and-coming firms tend to come with greater risk to match their growth potential.
“So, the good news is that the Russell 2000 is forging new all-time highs of its own.”
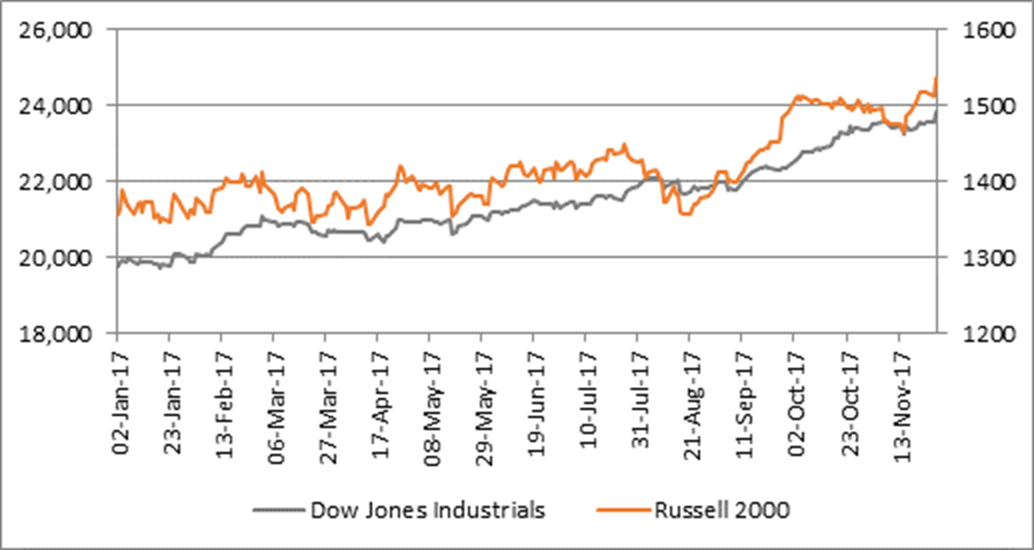
Source: Thomson Reuters Datastream
2. The Dow Jones Transportation index. “This includes airline, trucking and rail firms and is a good indicator because if goods are being shipped, then they are being sold and more will be made. But if the Transports index starts to falter (and the Industrials keep rising) then there could be trouble ahead.
“The news here is mixed. The Transportation index has been lagging and not leading of late. However, there was a powerful gain on Wednesday 29 November and investors will want to see Transports take the lead once more, as they did after two other periods of torpid performance earlier this year.”
Source: Thomson Reuters Datastream
3. The SOX index. “This 30-stock index features firms which are involved in the manufacture, sale or distribution of semiconductors. These tiny devices are a good proxy for US activity because everything from computers to handheld devices and from cars to industrial robots contain silicon chips. The chip cycle has also tended to be pretty boom-and-bust, owing to both its economic sensitivity and the tendency of chipmakers to add too much capacity when times are good, so their stocks can be a good guide to stock market risk appetite as their share prices tend to follow earnings momentum.
“Here the news is not so good. The SOX has had its first wobble since May with a 4.4% tumble on Wednesday 29 November. This could be a short term blip or a switch from tech and perceived growth stocks back to financials and cyclical, egged on by hopes for tax reform and accelerating growth in the USA.
“However, investors need to be on their toes because if it isn’t it could herald a more ominous sign of a slowdown in US activity or a shift in broader risk appetite.”

Source: Thomson Reuters Datastream
“Whilst none of these indicators are yet a screaming sell signal there is enough uncertainty here to suggest investors in the US market should be watching their portfolios carefully and considering when might be the right time to bank some of the handsome profit they could have made over recent months.”