The US Federal Reserve may still be dithering over a fifth interest rate hike of this upcycle (and third this year) but confirmation from chair Janet Yellen that the central bank is will start to withdraw its Quantitative Easing stimulus next month means investors must now face two questions, both of which have implications for the short- and long-term performance of the US economy, the global economy and therefore investment portfolios:
Even if the Fed held interest rates in the 1.00-1.25% range last night, its bias seems to be toward further increases, economic data permitting, so what degree of interest rate increase has historically been needed to stop US stocks in their bull-market tracks?
Since QE was launched, at least partly, to boost asset (stock and bond) valuations and create a so-called wealth effect, does this mean that its withdrawal could have the opposite result?
Russ Mould, investment director at AJ Bell, comments:
Interest rates
“The prospect of further rate hikes, no matter how gradual, begs the question of just how many more might it take to slow down the US equity market, or even halt it in its tracks.
“Since 1973, in the US it has tended to take between 8 and 9 rate rises to stop the US equity market in its tracks - and while the S&P 500's prior peaks came when rates were at 5.5% (1973 and 1976), 15% (1980), 9.375% (1983), 6.75% (1987), 8% (1990), 6% (2000) and 4.25% (2007) the trend in those peaks is lower because the world's debt pile has grown - so the global economy is now much more sensitive to even minor changes in borrowing costs. This could negate the bull case for stocks that is based on interest rates not reaching prior cyclical peaks for a very long time, because they may not need to.
| S&P 500 | Fed funds rate | Change in Fed Funds | Change in Fed Funds cycle |
Date | peak level | at S&P peak | cycle before | before S&P 500 peak |
11-Jan-73 | 120 | 5.50% | 3.50% to 5.50% | 2.00% |
21-Sep-76 | 1,008 | 5.50% | 4.75% to 5.50% | 0.75% |
28-Nov-80 | 141 | 15.00% | 4.75% to 15.00% | 10.25% |
10-Oct-83 | 173 | 9.38% | 8.50% to 9.38% | 0.88% |
25-Aug-87 | 337 | 6.63% | 5.88% to 6.75% | 0.88% |
16-Jul-90 | 369 | 8.00% | 9.81% to 8.00% | -1.81% |
24-Mar-00 | 1,527 | 6.00% | 4.75% to 6.00% | 1.25% |
09-Oct-07 | 1,565 | 4.25% | 3.75% to 4.25% | 0.50% |
|
|
|
|
|
Average |
|
|
| 1.84% |
Average excl. 1990 |
|
|
| 2.36% |
Source: Thomson Reuters Datastream
Quantitative Easing
“The merits of QE as a tool for promoting economic growth remain open to debate but the stimulus has done wonders for asset valuations and investors around the world must now face the next leg in the great monetary experiment as the US Federal Reserve finally readies itself to start shrinking its balance sheet and withdrawing QE.
“The Fed’s plan is to sterilise QE by letting its bond holdings mature and not reinvest the coupons in new holdings. The initial rate will be $10 billion a month, rising in $10 billion increments each quarter until the run rate reaches $50 billion.
“Now that the Fed will begin to remove the $3.6 trillion of stimulus pumped into the US economy from October, the slow pace of withdrawal announced in June means it would take until early 2024 to complete the process.
“If QE boosted asset valuations then it seems logical to assume its withdrawal may have the opposite effect – unless the US economy and corporate earnings again take up the slack very quickly.”
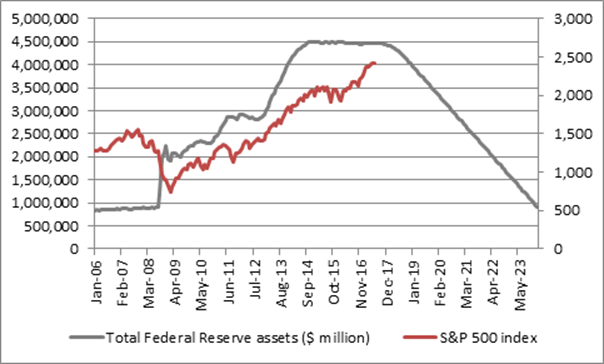
Source: FRED, St. Louis Federal Reserve and AJ Bell estimates, assuming Fed starts to shrink its balance sheet in line with rate outlined at June meeting from October 2017.