• The US stock market’s October valuation was the highest since September 2018, according to the Shiller PE ratio, compiled by the Nobel prize-winning economist Robert Shiller
• Valuations were only higher in:
September 1929 (just before the Wall Street Crash)
1997 to 2001 (the dotcom boom and bust)
December 2017 through to September 2018 (President Trump’s corporate tax cut from 35% to 21% was signed into law in December 2017)
• The US has been the best performing major market of the last ten years, but UK fund investors are significantly underweight the US, and overweight the UK
Laith Khalaf, financial analyst at AJ Bell:
“The valuation of the US stock market is pretty eye-watering by historical standards, but what’s particularly remarkable is that such a lofty premium has been achieved at a time of extreme stress for the global economy.
“A buoyant US stock market in the face of such economic adversity can be put down to ultra-low interest rates, fiscal stimulus, and the impervious sales growth of the big tech companies that sit atop the S&P 500. The FAANGs, and Microsoft, just six companies, currently make up 25% of the S&P 500, up from 7% ten years ago.
“This will of course leave value investors, and perhaps anyone with some sense of proportion, shrieking in horror. But value investors have cried wolf on this score before. Since the Shiller PE ratio last hit a peak in January 2018, the S&P 500 has risen by 24%.
“When the biggest companies in the world are delivering such high levels of secular growth, one might question whether traditional valuation metrics like the Shiller PE are simply outdated methods of predicting returns. But then again, the moral of the boy who cried wolf, is that the wolf does eventually show up.
“The Shiller PE is a useful measure of market valuation in a long historical context, and should be considered by investors as one perspective on the market, alongside others. Clearly the result, or lack of a result, in the US election will influence the direction of the market in the short term, but investors should look beyond that to the long run returns the market can deliver.”
The Shiller PE ratio
The Shiller PE or CAPE ratio (Cyclically Adjusted Price Earnings ratio) is a widely watched measure of US stock market valuation compiled by Robert Shiller, Sterling Professor of Economics at Yale University.
A typical price earnings ratio takes the price per share of a company on the stock market, and divides it by the earnings per share of that company. Shiller compiles that data for the US stock market as a whole, but rather than looking at one year of earnings, he takes an average of the last ten years’ of earnings (adjusted for inflation) and compares this with the current price.
The resulting index gives a view of US stock market valuations based on longer term earnings and does so in the context of a historical series that runs back 140 years.
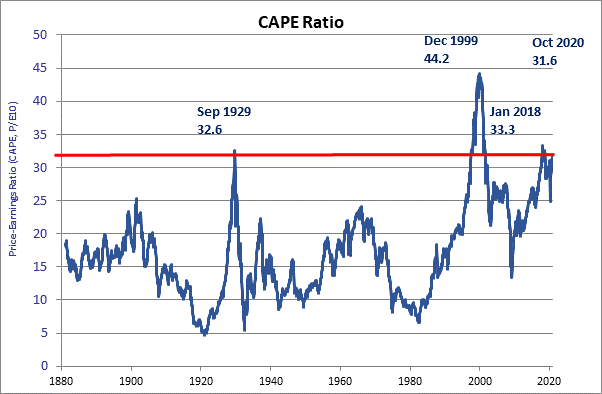
The latest reading, for October 2020, sits at 31.6 times earnings, its highest level since September 2018, when it sat at 32.6.
2017/2018 itself was a high point in the ratio, prior to that the ratio has only ever been higher in 1997 to 2001 (the dotcom boom and bust), when it peaked at 44.2 times earnings in December 1999, and in September 1929 (just before the Wall Street Crash) when it peaked at 32.6 times earnings.
(Source: http://www.econ.yale.edu/~shiller/ October data based on 23rd October 2020 closing prices)
UK fund investors are underweight US
UK fund investors are significantly underweight the US and overweight the UK in their portfolios, and have watched the US index go from strength to strength while our home market brings up the rear. In recent years investors have sold out of UK funds, but this sector still tops the charts in terms of the amount of assets invested, followed closely by global funds.
|
US |
UK |
Europe |
Japan |
Other |
|
|
Fund investors |
27.7% |
40.3% |
13.0% |
5.3% |
13.6% |
|
Global market* |
58.3% |
3.5% |
12.9% |
6.9% |
18.5% |
|
Over/underweight |
-30.5% |
36.8% |
0.1% |
-1.5% |
-4.9% |
|
10 year market total return |
304.0% |
58.7% |
87.5% |
126.3% |
N/A |
Sources: FE, Morningstar, IA, MSCI. Market returns in pounds sterling.
*MSCI AC World Index
The US market has returned 304% for UK investors (in British pounds), but fund investors only have a 27.7% portfolio allocation to this region, when it makes up 58.3% of global stock market value, as measured by the MSCI AC World Index.
By contrast UK fund investors are overweight the UK, to the tune of 36.8%, which has been the worst performing of the major developed markets for sterling-based investors.
There are longstanding reasons for the funds market in this country being skewed to the UK over the US, for instance the fact that the UK market has historically been a great source of dividends for income seekers. Moreover as the funds market developed in the UK, it was natural that fund groups provided a UK equity fund first and foremost, as this was investors’ home market, and in theory easier for stock pickers to add value compared to the heavily analysed US market.
Things have changed and UK equity funds have seen heavy outflows in recent years, but they had gathered so many assets over the last thirty or so years that the UK All Companies sector is still the biggest in terms of money held there, despite the poor relative performance of the UK stock market.
Top 5 Investment Association fund sectors by AUM
|
Fund sector |
Funds under management / £billion |
|
UK All Companies |
149.7 |
|
Global |
138.9 |
|
£ Corporate Bond |
76.6 |
|
North America |
71.4 |
|
Mixed 40-85% Shares |
64.6 |
Source: Investment Association as at August 2020
Prospects for US and UK stock markets
“While it’s undeniable that the US stock market has been the place to be over the last ten years, looking in the rear-view mirror isn’t the best way to navigate if you’re planning on driving forwards.
“The US might well continue to shine if the strong keep getting stronger. The likes of Amazon, Apple and Netflix have thrived in the pandemic, and while valuations look lofty, that’s been the case for some time and it hasn’t stopped investors turning a healthy profit. What’s more, a shake up in the US market can be expected to dampen markets around the globe, so if you’re negative on the US, it’s hard to be positive on other markets at the same time.
“For UK investors, the question of whether to invest in the US stock market is further clouded by Brexit negotiations, which if successful, could deliver a stronger pound, and thereby weaken returns from holding US stocks.
“To keep up with the global weighting, UK investors would need to hold £6 in every £10 in their portfolio in the US market. That looks pretty high for a foreign market which comes with such a hefty price tag, even if it is the biggest and most influential. The UK market by contrast is looking much less expensive, though some of the cyclical industries in the UK market are clearly battling a weakening economic picture.
“Switching from the UK to the US at the moment means swapping around £6 of UK company earnings for £4 of US company earnings. That makes sense if you expect much higher levels of growth from US companies in future, and indeed, that’s what the different valuations reflect. As ever the sensible approach is not to commit too much to one market, and to keep a balanced portfolio that has a foot in all camps.”