“Tuesday’s advance in the FTSE 100 was the index’s second-best individual day in its history in percentage terms and its best in both points and actual monetary value, bringing investors some welcome relief after a month-long drubbing,” says Russ Mould, AJ Bell Investment Director. “However, investors will still need to tread carefully. Six of the FTSE 100’s ten single-largest percentage daily gains of modern times came between September and December in October 2008 but the index only bottomed in March 2009 after a further heavy falls of nearly 30% as the effects of the collapse of Lehman Brothers and the ongoing global recession continued to hit confidence, corporate earnings and cash flows.
“A hefty rise in the FTSE 100 is welcome, should it transpire, but there remains the risk that any such advance proves fairly temporary should news on the viral outbreak continue to get worse and policy measures require a longer lockdown – and potentially deeper hit to global economic activity – than currently hoped.
|
Biggest one-day gains in the FTSE 100 since launch on 3 January 1984 |
|||||||
|
In percentage terms |
|
In points |
|
In value (£ billion) |
|||
|
24-Nov-08 |
9.8% |
|
24-Mar-20 |
452 |
|
24-Mar-20 |
113.5 |
|
24-Mar-20 |
9.1% |
|
19-Sep-08 |
431 |
|
19-Sep-08 |
102.9 |
|
19-Sep-08 |
8.8% |
|
24-Nov-08 |
372 |
|
24-Nov-08 |
92.2 |
|
13-Oct-08 |
8.3% |
|
13-Oct-08 |
325 |
|
29-Oct-08 |
85.3 |
|
29-Oct-08 |
8.1% |
|
29-Oct-08 |
316 |
|
20-Jul-05 |
78.3 |
|
21-Oct-87 |
7.9% |
|
24-Jan-08 |
266 |
|
13-Oct-08 |
77.6 |
|
08-Dec-08 |
6.2% |
|
10-May-10 |
264 |
|
10-May-10 |
68.0 |
|
13-Mar-03 |
6.1% |
|
08-Dec-08 |
251 |
|
24-Jan-08 |
63.1 |
|
10-Apr-92 |
5.6% |
|
29-Jun-16 |
220 |
|
08-Dec-08 |
60.9 |
|
20-Oct-08 |
5.4% |
|
20-Oct-08 |
220 |
|
29-Jun-16 |
57.0 |
Source: Refintiv data
“Seven of the ten biggest gains in the index in percentage terms all took place during the bear markets of 1987 and 2007-09, with the sole exceptions coming in April 1992, as the UK emerged from a recession, and March 2003, as the UK again began to show some improved economic momentum following the collapse of the technology bubble in 2000.
“The FTSE 100 has just entered its fifth bear market in its history. Analysis of the four previous downturns in 1987, 1998, 2000-03 and 2007-09, show that those bear markets were actually littered with sharp rallies which cruelly turn out to be nothing more than bear traps for the unwary, who were tempted into a ‘buy-on-the-dip’ strategy, only to quickly find themselves in trouble.
“The sharp-and-swift 1987 bear market happened so fast that investors only tried one, failed rally before dip-buyers were swept away by Black Monday, 19 October 1987, and then even heavier losses on the following day as London caught up with a 20% single-day fall in New York.
|
One major rally during 1987 bear market in the FTSE 100 |
||||||
|
Start |
Finish |
Duration (days) |
Start |
Finish |
Gain % |
Gain Points |
|
20-Aug-87 |
05-Oct-87 |
46 |
2,185 |
2,386 |
9.2% |
201 |
|
|
|
|
|
|
|
|
|
Overall 1987 Bear market |
||||||
|
Start |
Finish |
Duration (days) |
Start |
Finish |
Loss % |
Loss Points |
|
16-Jul-87 |
09-Nov-87 |
116 |
2,443 |
1,565 |
(35.9%) |
878 |
Source: Refinitiv data
“The 1998 bear market followed a currency and debt crisis in Asia, and then a Russian debt default, which first threatened to spill over into economic activity in the West and then destabilise financial markets when the LTCM hedge fund collapsed thanks to huge losses. A Federal Reserve co-ordinated bail-out of LTCM enabled markets to regain their poise, as did a rapid sequence of interest rate cuts.
“Investors will be hoping that this is the model this time around. There were no attempted rallies as the rout was swift but short and policy response shored up confidence equally quickly. The danger is that this time around America interest rates started at 1.75% (and have already been cut to 1.25%), not 7.5%, the early signs are the economic hit could be greater and equity valuations were much higher as the crisis began.
“But this then takes us to the bear markets of 2000-03 to 2007-09, where the combination of recessions, lofty valuations and corporate earnings disappointments meant that a sequence of rallies became wicked bear traps for those who loved to buy on the dips.
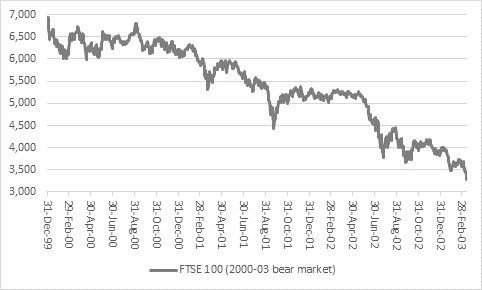
“The 2000-03 bear market, which followed the collapse of the technology, telecoms and media bubble witnessed seven major rallies. Those advances generated a combined gain of 4,590 points between them, even as the index fell by 3,643 points from top to bottom, showing how much additional pain would have been suffered by anyone who was tempted to pile into the market by these rallies.
|
Seven major rallies during 2000-03 bear market in the FTSE 100 |
||||||
|
Start |
Finish |
Duration (days) |
Start |
Finish |
Gain % |
Gain Points |
|
15-Feb-00 |
24-Mar-00 |
38 |
6,005 |
6,739 |
12.2% |
733 |
|
17-Apr-00 |
02-Jun-00 |
46 |
5,995 |
6,626 |
10.5% |
632 |
|
29-Jun-00 |
04-Sep-00 |
67 |
6,239 |
6,798 |
9.0% |
559 |
|
22-Mar-01 |
22-May-01 |
61 |
5,315 |
5,977 |
12.5% |
662 |
|
20-Sep-01 |
06-Dec-01 |
77 |
4,557 |
5,370 |
17.8% |
813 |
|
24-Jul-02 |
27-Aug-02 |
34 |
3,777 |
4,450 |
17.8% |
673 |
|
24-Sep-02 |
21-Nov-02 |
58 |
3,671 |
4,190 |
14.1% |
519 |
|
|
|
|
|
|
|
|
|
Overall 2000-03 Bear market |
||||||
|
Start |
Finish |
Duration (days) |
Start |
Finish |
Loss % |
Loss Points |
|
31-Dec-99 |
12-Mar-03 |
1167 |
6,930 |
3,287 |
(52.6%) |
3,643 |
Source: Refinitiv data
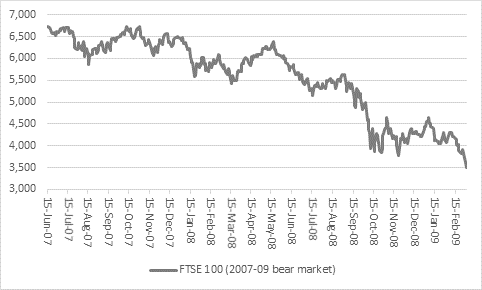
“The same portfolio-pounding pattern could be seen during the 2007-09 bear market. Nine rallies, some of them stunning upward spikes, only dragged investors into deeper trouble if the joined in. Those nine rallies added 5,853 points between them even as the FTSE 100 sank by 3,220 points during the course of the bear decline.
|
Nine major rallies during 2007-09 bear market in the FTSE 100 |
||||||
|
Start |
Finish |
Duration (days) |
Start |
Finish |
Gain % |
Gain Points |
|
16-Aug-07 |
12-Oct-07 |
57 |
5,859 |
6,731 |
14.9% |
872 |
|
21-Nov-07 |
10-Dec-07 |
19 |
6,071 |
6,565 |
8.1% |
495 |
|
21-Jan-08 |
26-Feb-08 |
36 |
5,578 |
6,087 |
9.1% |
509 |
|
17-Mar-08 |
19-May-08 |
63 |
5,414 |
6,376 |
17.8% |
962 |
|
16-Jul-08 |
29-Aug-08 |
44 |
5,151 |
5,637 |
9.4% |
486 |
|
18-Sep-08 |
19-Sep-08 |
1 |
4,880 |
5,311 |
8.8% |
431 |
|
10-Oct-08 |
14-Oct-08 |
4 |
3,932 |
4,394 |
11.8% |
462 |
|
16-Oct-08 |
04-Nov-08 |
19 |
3,861 |
4,640 |
20.2% |
778 |
|
21-Nov-08 |
06-Jan-09 |
46 |
3,781 |
4,639 |
22.7% |
858 |
|
|
|
|
|
|
|
|
|
Overall 2007-09 Bear market |
||||||
|
Start |
Finish |
Duration (days) |
Start |
Finish |
Loss % |
Loss Points |
|
15-Jun-07 |
03-Mar-09 |
627 |
6,732 |
3,512 |
(47.8%) |
3,220 |
Source: Refinitiv data
“The charts of both bear markets show how the attempted rallies quickly crumbled in the face of more corporate profit downgrades and economic bad news. Note how almost without exception, each new rally failed to reach the high set by the previous attempt to break free of the bear market’s hug, and how each one nearly always gave way to a new low.
“It is this classic sequence of ‘lower highs and new lower lows’ that investors could do to see broken and broken quickly. If it is not, the further nasty falls could follow, at least if history is any guide.
Source: Refinitiv data
Source: Refinitiv data
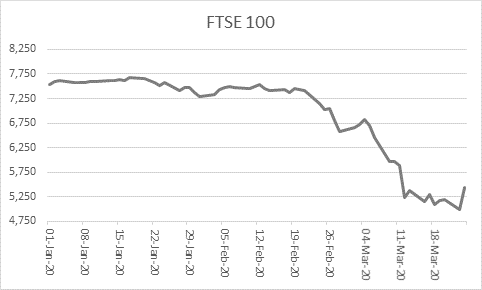
“This is not to say that the bear market that began in January is guaranteed to follow this dismal path.
“The good news is that today’s major move breaks a gathering cycle of lower new high and that is a welcome start. It is important now, from a technical point of view, that this advance does not quickly subside and then give way to a fresh low.
Source: Refinitiv data
“If the virus is rapidly contained and the hit to economic activity proves limited then UK equities could rally sharply. But if it is not and corporate cash flows are severely crimped by the knock-on effects of the outbreak, investors may need to be wary of big rallies and – if they are minded to be contrarians and put money into the market now – instead look to buy after any further big falls to patiently average their way in over time.”
