

Archived article: Please note that tax, investment, pension and ISA rules can change and the information and any views contained in this article may now be inaccurate.
After ending 2016 on a hot streak, with three consecutive closing record highs, the FTSE 100 continues to barrel higher, with the 7,200 mark now firmly in its sights.
FTSE 100 set a run of new all-time record highs at the turn of the year

Source: Thomson Reuters Datastream
This naturally begs the question of whether this momentum can be maintained and if so why – and if not, then why not.
To get a better understanding of this it is necessary to look at the index’s make-up and which sectors and stocks wield the greatest influence, both in terms of their market capitalisation and their contribution to the benchmark’s aggregate profits and dividend payments.
This issue of mix will have a great say in how the FTSE 100 may perform in 2017 and beyond and investors really need to keep their eyes on just four sectors, or groupings of stocks. They are (in alphabetical order):
- Banks
- Insurers (life and non-life)
- Mining
- Oil & Gas Producers
An aggregate of bottom-up analysts’ consensus forecasts shows that this quartet is expected to generate roughly half of the index’s total sales, profits and dividend payments in 2017.
More potently still these four sectors are forecast to provide three-quarters of the forecast growth in earnings and half of the forecast growth in dividends.
For the moment, these sectors are seen as a positive. Steepening yield curves are helping banks, rising bond yields are helping insurers and rising commodity prices are lifting the resources plays. All of this is linked to the reflation, or Trumpflation trade, which is also boosting the dollar and in turn the FTSE 100’s overseas earners, who generate around two-thirds of the benchmark’s total earnings.
So long as the Trump trade remains in favour, the FTSE 100 could continue to do well, especially as a yield of 4% could provide a bedrock of support from income hunters – and the higher oil and commodity prices go the better dividend cover becomes, as it is thinner than ideal at around 1.65 times for 2017.
Equally, it can be argued that what the FTSE 100 may offer in terms of quantity of earnings, it lacks in quality. All four of these key sectors were a handicap to varying degrees in 2014 and 2015, when the index basically went nowhere fast. All remain difficult to predict and as such investors must remain on their guard, as if the Trump trade begins to falter, and growth concerns reappear, then the FTSE 100 could start finding it a lot tougher to make progress once more.
Feel the width
While it is possible to pick holes in the quality of the FTSE 100’s earnings and question the provenance of the improvement, the earnings recovery currently forecast by analysts for 2017 once their bottom-up, company-by-company forecasts are aggregated does look impressive.
FTSE 100 total profits are expected to rebound strongly in 2017
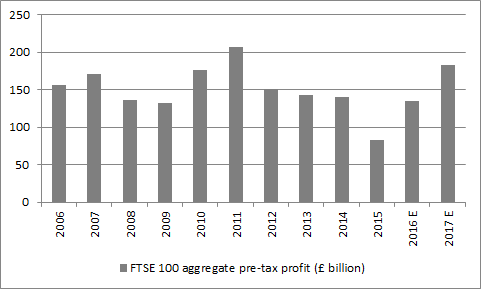
Source: Digital Look, consensus analysts’ estimates
Even if the projected £183 billion pre-tax profit total for 2017 still falls short of the £206 billion seen when oil and metals prices were in their pomp it still exceeds the £170 billion figure recorded in 2007 when the FTSE 100 last topped out.
The projected dividend payout figure of £77.6 billion represents another year-on-year advance and in the case of both dividends and profits consensus estimates have risen for the past two calendar quarters. This is a marked – and welcome – contrast to the grinding pattern of downgrades which characterised 2014, 2015 and 2016. The charts below show how estimates slipped consistently lower for those years and how 2017 has, for now, forged some more positive momentum.
FTSE 100 profit forecasts for 2017 are creeping higher ...

Source: Digital Look, consensus analysts’ estimates
... as are analysts’ estimates for total dividend payments

Source: Digital Look, consensus analysts’ estimates
Friendly trend
This may help to explain why stocks are starting to outperform bonds. This can be shown simply by comparing the performance of an exchange-traded fund (ETF) designed to track broad stock and bond benchmarks. In this case, we have used the iShares FTSE 100 ETF and the iShares Core UK Gilts ETF, which have the EPIC of ISF and IGLT respectively. Dividing the price of the equity tracker by that of the Gilts one gives a feel for relative performance – if the line rises, equities are doing better and if it falls then Gilts are in charge.
UK stocks have begun to outperform UK Government bonds

Source: Thomson Reuters Datastream, Otterwood Capital
While this will please those investors who have greater exposure to stocks than they do to bonds, they will still need to ensure such a trend can be relied upon to last. This requires analysis of where the FTSE 100’s growth is expected to come from and whether these stocks and sectors are themselves reliable.
To look at a static snapshot of the index, this table shows which sectors are expected to make the largest contributions to sales, profits and dividends in 2017. Banks, insurers (bracketed together in the ‘financials’ bucket), miners and oil and gas stocks are forecast by analysts to provide 48% of total profit and 50% of total dividend payments in 2017.
Four sectors dominate the FTSE 100’s profit and dividend forecasts for 2017
| Percentage of profits | 2017 E | Percentage of dividends | 2017 E | |
| Financials | 23% | Oil & Gas | 25% | |
| Oil & Gas | 15% | Financials | 22% | |
| Consumer Staples | 15% | Consumer Staples | 11% | |
| Consumer Discretionary | 11% | Health Care | 10% | |
| Mining | 10% | Consumer Discretionary | 9% | |
| Health Care | 9% | Industrial goods & services | 7% | |
| Industrial goods & services | 9% | Telecoms | 7% | |
| Telecoms | 4% | Utilities | 5% | |
| Utilities | 4% | Mining | 3% | |
| Real estate | 1% | Real estate | 1% | |
| Technology | 0% | Technology | 0% |
Source: Thomson Reuters Datastream
This quartet’s influence looks all the more potent when their contribution to growth in earnings and dividends is assessed. In this case, they are forecast to provide 76% of the anticipated £48.7 billion increase in FTSE 100 pre-tax profits and 52% of the projected increase in dividends (where oil and gas is seen making a negligible contribution).
Four sectors dominate the FTSE 100’s profit and dividend growth forecasts for 2017
| Percentage of profits growth | 2017 E | Percentage of dividend growth | 2017 E | |
| Oil & Gas | 32% | Mining | 31% | |
| Mining | 30% | Financials | 22% | |
| Financials | 14% | Consumer Staples | 17% | |
| Consumer Staples | 9% | Consumer Discretionary | 12% | |
| Health Care | 6% | Industrial goods & services | 11% | |
| Consumer Discretionary | 4% | Telecoms | 2% | |
| Industrial goods & services | 3% | Utilities | 2% | |
| Telecoms | 2% | Health Care | 2% | |
| Utilities | 1% | Technology | 1% | |
| Technology | 0% | Real estate | 1% | |
| Real estate | 0% | Oil & Gas | -1% |
Source: Thomson Reuters Datastream
Sector selector
Some investors may feel more comfortable with this mix than others, given that all four generally disappointed shareholders in 2015 and 2015 before roaring back into fashion in 2016. Between them banks, insurers, miners and oils represent 45% of the FTSE 100’s current £1.9 trillion market cap and their historic volatility means they cannot relied upon implicitly.
For the moment, however, their respective indices all appear to be pointing in the right direction, as this next selection of charts shows.
Banks sector began to rally in the second half of 2016 ...

Source: Thomson Reuters Datastream
... while the life and non-life insurers made some progress ....

Source: Thomson Reuters Datastream
... and miners entered 2017 strongly after topping the performance tables in 2016 ...

Source: Thomson Reuters Datastream
.... closely followed by oils, which rode the recovery in the oil price.

Source: Thomson Reuters Datastream
For the FTSE 100 to perform strongly in 2017, these areas all need to deliver the profit and dividends expected of them. All four are suited by the market’s current preferred narrative, namely that economic growth and inflation will accelerate in 2017, thanks to a shift from austerity to fiscal stimulus, particularly in the USA under President Trump but also potentially in Japan, Canada, the UK and others. If this scenario pans out as expected, then the dollar, oil, metals prices and Government bond yields could all rise, to the potential benefit of the key mining, oils, banks and insurance sectors.
If that agenda gets blocked, or fails to generate the expected improved momentum, then there could be trouble ahead. Weaker-than-expected growth could hit metals and oil prices and persuade central banks to keep interest rates lower for longer, exerting some gravitational pull on bond yields, to the potential detriment to the four key sectors, to varying degrees.
An investor who wants exposure to UK equities may feel handily served by a FTSE 100 tracker or exchange-traded fund, but they need to know what they are buying or relying upon – and in this case it is a select list of stocks and sectors.
Equally, anyone choosing an actively-managed fund will want to divine how the fund manager views these four sectors in particular. This can be done by looking at a fund’s weightings toward each one and getting them right will go a long way to determining whether a collective will outperform or underperform the UK’s benchmark indices in 2017 and beyond.
To help in this regard, we have adapted our usual fund performance tables to show the sector weightings of the top five performing UK equity ETFs over the past five years and top 10 performing large cap UK equity funds.
Note that in total the financials, oils and miners represent 45% of the FTSE 100 by market cap (breaking down as 22%, 15% and 8% respectively).
Best performing UK Large-Cap Blend Equity ETFs over the past five years
| ETF | Market cap £m | Annualised 5-year performance | Sector weighting | TOTAL | ||
| Financials | Mining | Oils | ||||
| Lyxor UCITS ETF FTSE All-Share GBP | 12.1 | 9.46% | 22% | 9% | 13% | 44% |
| db x-trackers FTSE All Share UCITS ETF (DR) 1D | 81.4 | 9.40% | 22% | 9% | 14% | 45% |
| Lyxor UCITS ETF FTSE 100 C-GBP | 623.6 | 8.71% | 22% | 10% | 15% | 47% |
| iShares FTSE 100 UCITS ETF GBP (Acc) | 361.4 | 8.58% | 22% | 9% | 16% | 47% |
| db x-trackers FTSE 100 UCITS ETF (DR) Inc 1D | 160.8 | 8.53% | 22% | 9% | 16% | 47% |
Source: Morningstar, for UK Large-Cap Blend Equity category.
Where more than one class of fund features only the best performer is listed.
Best performing UK Large-Cap Blend Equity OIECs over the past five years
| OEIC | Assets £m | Annualised 5-year performance | Sector weighting | TOTAL | ||
| Financials | Mining | Oils | ||||
| Investec UK Alpha I (Acc) | 1,179.2 | 15.6% | 17% | 11% | 8% | 35% |
| Majedie UK Focus X (Inc) | 805.4 | 15.2% | 30% | 13% | 19% | 61% |
| Ardevora UK Equity B | 181.0 | 14.5% | 19% | 7% | 6% | 32% |
| Invesco UK Equity C | 163.3 | 14.2% | 30% | 4% | 15% | 49% |
| Lazard UK Omega Retail C (Acc) | 89.4 | 14.0% | 27% | 13% | 16% | 55% |
| Jupiter UK Growth I (Acc) | 1,407.0 | 13.8% | 27% | 4% | 0% | 31% |
| Barclays UK Alpha (Series 2) I (Inc) | 53.2 | 13.2% | 24% | 10% | 12% | 46% |
| RWC UK Focus B GBP | 85.9 | 13.2% | 31% | 12% | 12% | 55% |
| Majedie UK Equity X (Inc) | 3,488.4 | 13.1% | 21% | 15% | 19% | 55% |
| Threadneedle UK Extended Alpha Instit (Acc) GBP | 130.3 | 13.1% | 18% | 7% | 7% | 32% |
Source: Morningstar, for UK Large-Cap Blend Equity category.
Where more than one class of fund features only the best performer is listed.
Russ Mould, AJ Bell Investment Director
Russ Mould: Investment Director
Russ Mould is AJ Bell's Investment Director. He has a Master's degree in Modern History from the University of Oxford and more than 30 years' experience of the capital markets.
He started out at Scottish...
