Archived article
Please note that tax, investment, pension and ISA rules can change and the information and any views contained in this article may now be inaccurate.
 magazine
What’s behind the new all-time high in US markets?

If you have just been reading the newspaper headlines over the last few months, it’s been rather gloomy material in general – from increasing US-China trade tensions to fears over Brexit and slowing global growth.
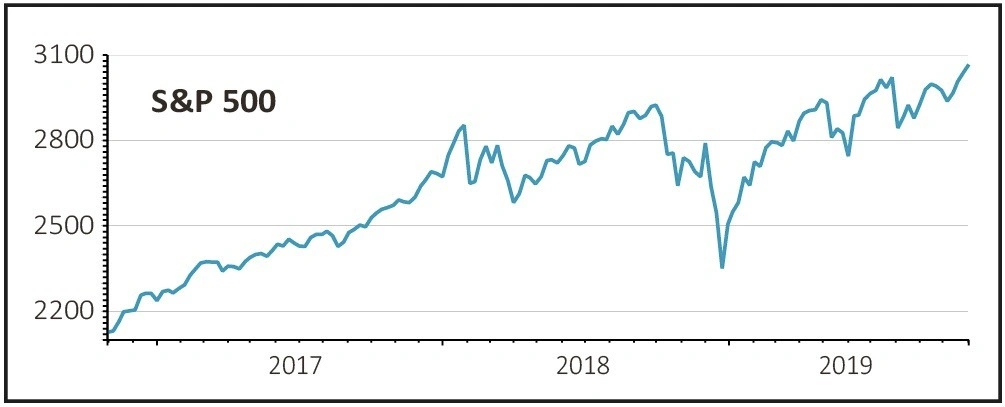
And yet one of the most followed global indices – the S&P 500 – hit a new all-time high on 4 November at 3,078. How can we explain this apparent disconnect?
Both the US and European central banks have moved to a loosening bias in response to slowdown concerns, but this has only added to a feeling that growth is becoming more challenging.
And the feat of the S&P 500 in reaching a fresh peak is all the more impressive when you consider it was achieved without help from one of its biggest constituents, online giant Amazon, which actually fell over the last three months.
To get to the bottom of things, Shares has taken a closer look at the biggest movers in the S&P 500 over the past three months and analysed data from Bloomberg to find out the most significant contributors to the strength of the index, as well as the laggards which have held it back.
INDEX CALCULATION
The S&P 500 index is designed to represent 500 of the largest quoted companies on the US market. Each constituent company is weighted by multiplying the number of shares in issue by the share price.
The biggest three companies account for just over 11% of the index, while the largest 10 companies account for around 23% of the index, and the top 20 account for around a third of the index.
After that there is a long-tail, which is to say that outside the top 20 companies, there are 480 companies which are much smaller in size and need to move a lot more than the larger companies to have the same impact on the overall index.
For example if the price of the largest constituent, software company Microsoft, were to rise by 10% it would push the S&P 500 index up by 0.2%, while heavy equipment maker Caterpillar, still not a small company with a market capitalisation of $78bn, would have to rise by 74% to have the same impact on the index.
For a discussion on how a handful of stocks can drive the entire market read this article.
As we will see later, this aspect of the market structure is very instrumental in explaining why the market is hitting all-time highs.
We have separated the biggest movers from the biggest contributors in order to focus on what investors have been buying and selling.
Biggest movers
The first thing that ‘jumps out’ of the data is the number of consumer goods companies which have done well. This begs the question, if the market is so worried about the economy, why would these types of business be in such demand?
Before we attempt to provide an answer, let’s look at some of the best performing names.
The largest gainer, up 40%, was Newell Brands which is a consumer brands company that owns Paper Mate, Waterman pens and Sharpie. Target was up 27% and distributes household and beauty products and accessories. Nordstrom, up 26%, distributes clothing.
What links these companies together is that all of them are predominately domestic players and only Newell Brands has any overseas sales exposure, and even this is only around 30% of its business.
Other domestically-focused companies also appear on the leader board such as housebuilders Lennar, up 27%, and Pulte, up 24%.
Federal Reserve chairman Jerome Powell recently said ‘global headwinds’ outside the US were a key factor driving the central bank’s more cautious stance. However, he was of the view that the domestic US economy remained strong with close to full employment.
What the data is saying to us is that investors appear to have taken Powell’s message to heart and rejigged their portfolios towards more domestically positioned companies and away from overseas earners.
Another factor influencing investor preferences has been the strength of the dollar which makes overseas earnings less valuable when converted back to the local currency.
Two semiconductor companies also make the top 10 list; Lam Research and KLA, up 34% and 26% respectively. While both companies earn virtually all of their revenue and profit in Asia, they have reported strong earnings, beating analysts’ estimates.
Lam Research is benefiting from strong demand in China for wafer fabrication equipment which helped it beat analyst estimates in its 24 October quarterly update. Its shares have almost doubled this year.
Align Technology, up 26%, operates in the medical equipment and dentistry sector and is also very domestically focused while it reported better than expected third quarter earnings on 24 October.

This impressive performance of the top 10 movers only explains 20% of the return of the index over the last three months. That is because collectively the list only adds up to less than 1% of the index.
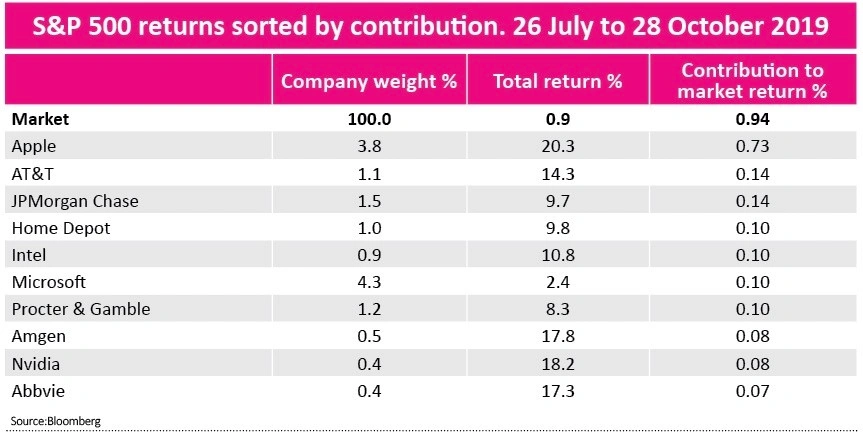
The largest contributors
The picture changes radically when we focus on the companies that had the biggest impact on the index. Heavyweights Apple, JPMorgan and Microsoft rose by 20.3%, 9.8% and 2.3% respectively.
All three companies hit all-time highs recently and they are clearly leading the market into the same virgin territory. It’s no coincidence that all three companies reported strong quarterly numbers in October, beating analysts’ estimates.

On 30 October Apple reported revenue 2% higher year-on-year to $64bn in the fourth quarter to 28 September. Importantly the company said that it expected $85bn to $95bn in sales in the current quarter that ends in December, above analyst’s consensus target of $87.5bn.
Microsoft also reported better than expected earnings on 23 October with revenue up 13.7% to $33.06bn. A week earlier, investment bank JPMorgan reported record investment banking fees and market share gains in consumer banking.
What may surprise some people is that the US stock market made a new high without any help from global online retailer Amazon, which had been leading the market for much of the past few years.
Amazon was the biggest negative contributor to the index shaving 0.3% from the market as its shares fell by 9% over the past three months. On 24 October the shares fell a further 8% after its fourth quarter numbers disappointed investors. The company forecast sales of $80bn to $86bn for the crucial holiday period compared with $87bn expected from analysts.
One final thought on interpreting new US market highs is to look carefully at the number of stocks participating in the rise. Generally speaking the more stocks, the better. Over the three month period under review, around half the index was in positive territory according to SharePad data.
Three ways to get exposure to the US stock market
iShares Core S&P 500 ETF USD Acc GBP (CSP1)
iShares is one of the largest providers of exchange traded funds (ETF) in the world and part of BlackRock, the world’s largest investment manager. This product tracks the S&P 500 index for an annual charge of 7 basis points, the equivalent cost of £7 for every £1000 of investment. The fund invests in all the constituents of the index and employs a so-called index replication strategy. The fund size is $35.5bn.
Fundsmith Equity (B41YBW7)
Run by Terry Smith, the £18.3bn global fund has roughly 60% of its assets in large US names such as payments firm Paypal and software giant Microsoft, which combined represent around 12% of the portfolio. The fund is relatively concentrated with 27 holdings. The annual management fee is 1%.
Scottish Mortgage Investment Trust (SMT)
The trust takes a long-term approach and attempts to identify the best companies in the world and invest in them for at least five years. An excellent long-term track record has resulted in the shares normally trading at a premium to net asset value, but the trust currently sits at a 2% discount, probably because of the poor performance recently of its largest holding Amazon. The trust has over 50% of its portfolio invested in the US market.

Important information:
These articles are provided by Shares magazine which is published by AJ Bell Media, a part of AJ Bell. Shares is not written by AJ Bell.
Shares is provided for your general information and use and is not a personal recommendation to invest. It is not intended to be relied upon by you in making or not making any investment decisions. The investments referred to in these articles will not be suitable for all investors. If in doubt please seek appropriate independent financial advice.
Investors acting on the information in these articles do so at their own risk and AJ Bell Media and its staff do not accept liability for losses suffered by investors as a result of their investment decisions.