Archived article
Please note that tax, investment, pension and ISA rules can change and the information and any views contained in this article may now be inaccurate.
 magazine
Why the 'lowest cost' ETFs aren't always the cheapest

How low can you go? Typically asked during a game of limbo, it has been a question increasingly posed by investors in exchange-traded funds (ETFs).
Pitched as a simple way to invest at a cheaper price than using the services of a fund manager, ETFs can invest in stocks for a charge as low as 0.04%, equating to 4p for every £100 invested.
That figure could get even smaller as the price war among ETF providers shows no sign of abating in 2020.
As with all investments however, while cost is definitely important, the headline fees isn’t the full story.
TOTAL COST OF OWNERSHIP
‘If you’re going to buy and hold an ETF for 20 years, clearly one that’s got a lower cost is going to work in your favour,’ says Matt Brennan, head of passive portfolios at AJ Bell.
But for those who plan to hold an ETF for anywhere between one and five years, Brennan says it is more important to look at what he describes as the ‘total cost of ownership’.
This includes the level of bid-ask spread you will encounter when looking to buy an ETF, or in other words the difference between the highest price a buyer is willing to pay and the lowest price that a seller is willing to accept.
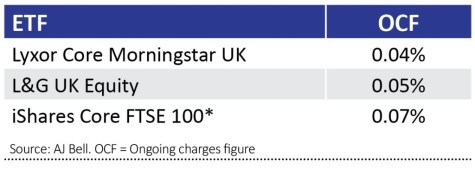
For example, the aforementioned ETF at 0.04% is Lyxor Core Morningstar UK (LCUK). It is almost half of the cost of the popular iShares Core FTSE 100 ETF (ISF) at a total expense ratio (TER) of 0.07%.
But the bid-ask spread for the Lyxor ETF is 0.2%, whereas the spread for iShares one is 0.05%, meaning despite the headline cost for the Lyxor ETF being 0.04%, the total cost of it is 0.24%, whereas the actual cost for the iShares one is half that at 0.12%.
Brennan says that looking at the size of an ETF can be an important factor.
The Lyxor ETF holds £44m of investors’ money, whereas the iShares one holds £8.5bn. The more investors in a fund, the more buying and selling of its shares there will be, which in turn means the bid-ask spread will generally be lower.
Aside from cost, performance is another important factor to consider. For developed markets such as the UK and US, it’s unlikely there will be much variance for ETFs investing in the likes of the FTSE 100 and S&P 500.
For areas such as emerging markets (EM) though, there can be significant differences.
Brennan uses the example of South Korea and the two main index providers, FTSE and MSCI.
MSCI classifies South Korea as an emerging market, whereas FTSE doesn’t. While it is impossible beforehand to say how well South Korea will perform, in 2019 the MSCI index – with South Korea in it – returned 12.7%, whereas the FTSE index returned 15.1%.
That’s a 2.4% difference which would negate any difference in the costs between different ETFs.
Headline costs for EM ETFs can vary greatly, costing anywhere from 0.18% to 0.5%.
The point here is that when it comes to more niche areas like emerging markets, be sure of what you want to invest in.
Brennan says: ‘In a UK ETF, you know you’re buying UK shares like HSBC (HSBA) and Royal Dutch Shell (RDSA).
‘But for emerging markets it can be more complex. It’s less about cost and more important to pick an ETF that best represents what you’re trying to get exposure to.’
LOOKING UNDER THE BONNET
To do this, he adds that it’s important to check what’s in the index. This is usually easy to do – just type the name into a search engine, e.g. MSCI World Index, and the index’s latest monthly factsheet is often among the first results that appear.
Using the MSCI World index as an example, it has 1,646 constituents so it’s neither practical nor necessary to go through a list of all of them.
But the factsheet will contain the top 10 constituents as well as a percentage breakdown of the countries and sectors which make up the index, which should give you a good enough idea of what’s in the index.
Though it must be said MSCI does a much better job of making its index information accessible than other providers, such as FTSE Russell and Solactive, which often require a little more digging on their websites to find the right information.
Sadly you also have to do some digging to find the total cost of ownership figures for ETFs. We haven’t found a central source of information, instead it requires you to look on each ETF provider’s website for the information or to contact them directly for the data.
Just remember that the ongoing charges figure is a good starting point for your research but it isn’t the complete picture. We now look at various parts of the market and reveal the ETFs with the lowest ongoing charges figure per category.
UK
As most ETFs track the FTSE 100 index, going for a low cost option is a good way for investors to get exposure to UK large caps. But as mentioned, be aware of the fund size, as this can potentially increase the bid-ask spread and negate any difference in headline cost.
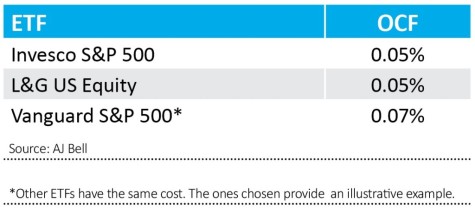
US
The US is considered the most efficient stock market in the world with the odds stacked against active fund managers outperforming. Most of the US-focused ETFs follow the same index. Most of the cheapest ones on offer have over £1bn in assets.
Global
Anyone investing in a global ETF should know they will most likely have more than half of their portfolio invested in US stocks, as most of them follow the MSCI World or FTSE World indices, which skew heavily towards the US.
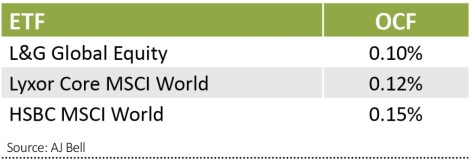
Picking a global dividend ETF which doesn’t use MSCI or FTSE indices is the most effective way to get a more truly diversified global exposure, though these ETFs typically cost twice the amount as more vanilla global ETFs.
Japan
One of the most popular ways to invest in Japan is via an ETF, particularly in the large cap space where the vast majority of active managers have historically underperformed. An active fund could be the way to go for Japanese small and mid-caps, which are the considered the least efficient stock markets in the developed world.
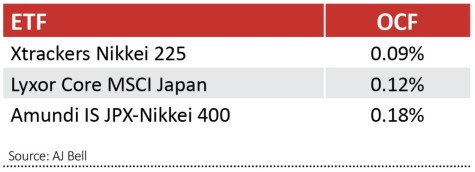
But for exposure to companies in the Nikkei 225 or 400, a low cost ETF seems to do the job better than a more expensive active fund.
Global Property
Property ETFs are yet to take off in the way bond ETFs have and options for investors are relatively limited, hence the charges tend to be higher than other sectors.
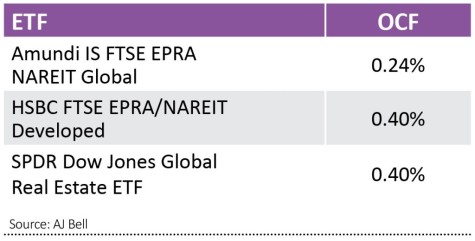
Most of those available for investors invest in real estate investment trusts (REITs) across global developed markets, typically in the US,
UK and Europe.
Global bonds
Bond ETFs have gained increasingly popularity with investors as they are a simple, low cost way to add bonds to a portfolio.
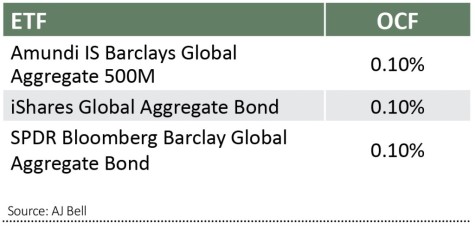
Given most of the biggest global bond ETFs are also the cheapest, they can provide a low total cost of ownership with a low bid/ask spread as well as headline cost. Please note that the lowest cost ones tend to track global aggregate bond indices, which are a mix of government and company bonds.
Global corporate bond ETFs, which invest in bonds of the biggest firms around the world, on the other hand typically cost more and have also performed better in the past year. Though underperformance could be higher in a market downturn, and past performance is no guide to future performance.
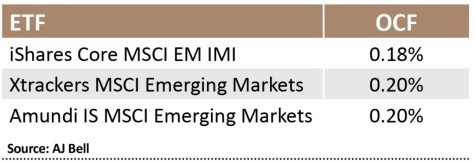
Emerging Markets
As mentioned, it’s important to check what’s in the index to ensure you’re getting the exposure you want. Most in this category follow the MSCI Emerging Markets index, with the exception of Vanguard FTSE Emerging Markets (VFEM).

Important information:
These articles are provided by Shares magazine which is published by AJ Bell Media, a part of AJ Bell. Shares is not written by AJ Bell.
Shares is provided for your general information and use and is not a personal recommendation to invest. It is not intended to be relied upon by you in making or not making any investment decisions. The investments referred to in these articles will not be suitable for all investors. If in doubt please seek appropriate independent financial advice.
Investors acting on the information in these articles do so at their own risk and AJ Bell Media and its staff do not accept liability for losses suffered by investors as a result of their investment decisions.