Archived article
Please note that tax, investment, pension and ISA rules can change and the information and any views contained in this article may now be inaccurate.
 magazine
Five ways to spot a market bottom
Late March’s sharp three-day rally is inevitably begging the question as to whether markets are nearing or are even past the bottom after the savage sell-off that dates back to 24 February.
This column still has its doubts, not least because history suggests market downturns are usually littered with rallies that turn out to be no more than vicious bear-market traps.
That said, the sudden nature of the downturn means that it is tempting to think the rebound could be equally sharp.
The price collapse of February and March, coupled with a surge in the VIX, or ‘fear index’, to new highs implies that sentiment has already switched from greed to fear.
That is usually a good starting point for some contrarian value-hunting but there are other signals which investors can use if they are looking for signs that we may be coming through the worst.
Five signs
The first thing markets want to see is a slowdown in the number of new COVID-19 cases on a global basis (and not just for narrow, self-interested reasons but more importantly simply for the greater good).
A slowdown and then a peak in new cases could give markets more of a chance to work out the duration and depth of the damage done to corporate earnings and cash flows.
In turn markets might be able to assess whether the share price falls seen so far adequately reflect this or not, even if this again pales next to the importance of individuals’ health.
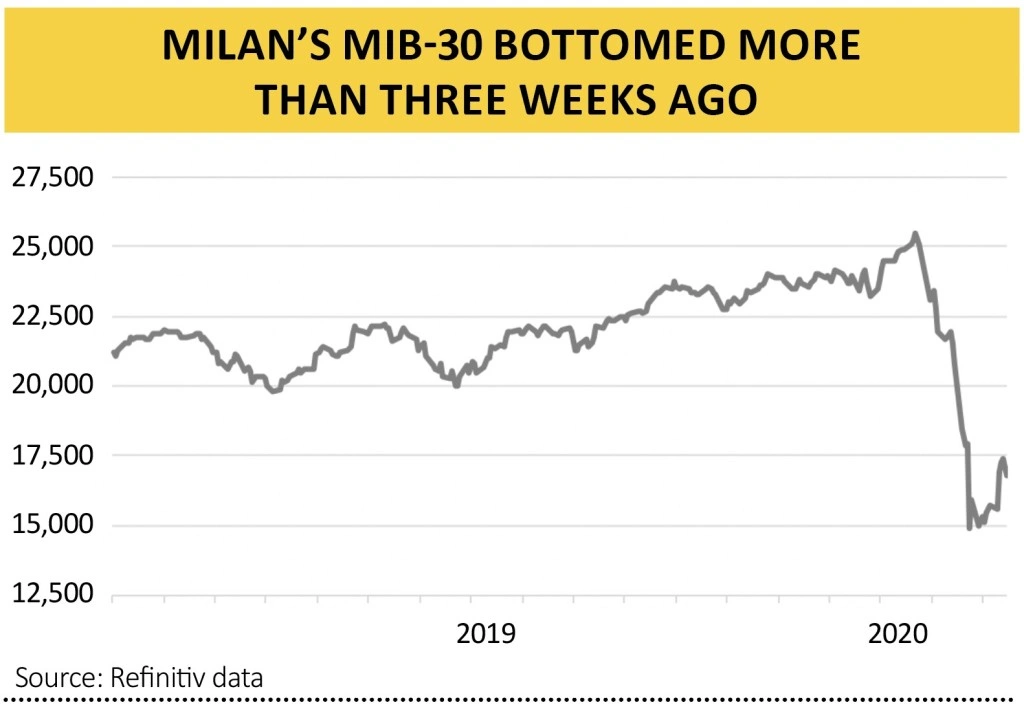
Tracking the momentum in new cases via the media is one way but another might be to look at Italy. The country remains, for the moment at least, in the eye of the storm so far as Europe is concerned and all eyes are on how quickly the outbreak can be contained.

It is intriguing to note how Milan’s MIB-30 index hit a bottom on 12 March and has since advanced by 13% in a fairly orderly fashion. This could just be wishful thinking but it could be something so this is a trend to note.
More tangibly, it would be nice to see some improvement in the price of copper and for that matter other industrial metals such as aluminium. Copper’s ubiquity, as well as its malleability and conductivity, means it is used heavily in industry so a rebound in activity should show up quickly. Even though the global mining sector is trying to forge a rally, the bad news is that copper is still stuck well below $5,000 a tonne.
Transport stocks are also a good barometer. If goods are selling, then shelves need to be restocked and those products have to be shipped. If they are not selling then freight volumes suffer.
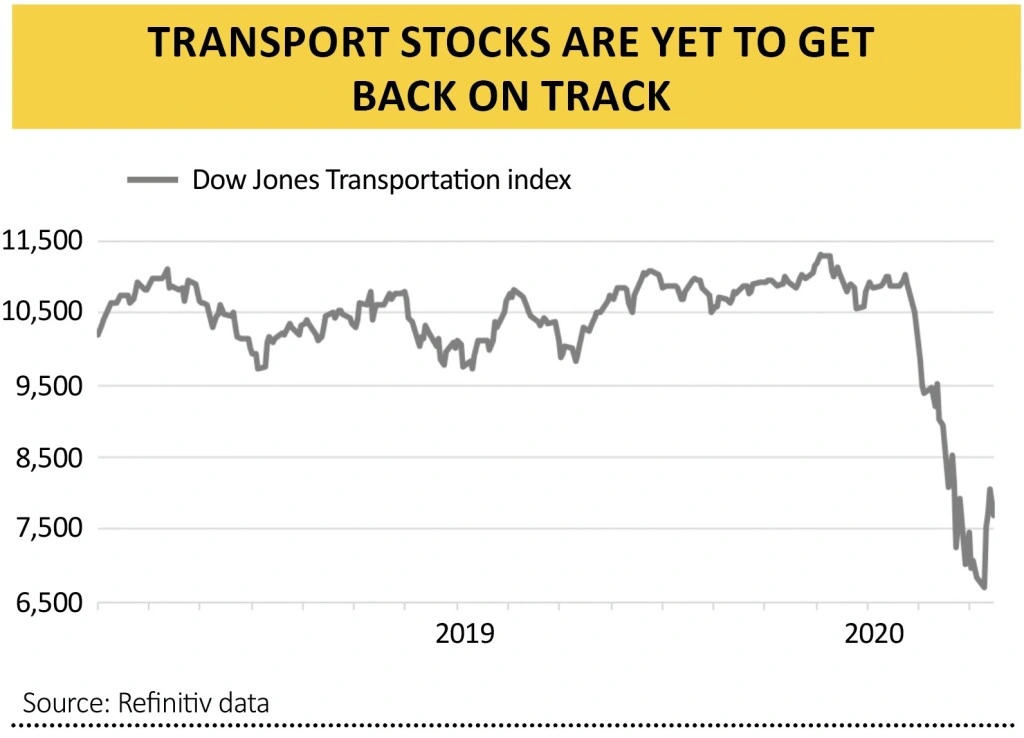
As this column pointed out several times last year, transport stocks have lagged for a while. Last week’s rally is a start but the transport stocks have yet to prove they have broken out of reverse gear. It would be a welcome sign if they do.
Another good guide to both economic activity but also financial markets’ appetite for risk are junk bonds. The risks involved mean they trade quite like equity. And the Federal Reserve is currently barred from buying them so you could argue that junk bonds are not a rigged market, unlike government and investment-grade bonds, when central bank interference means we have little or no price discovery.
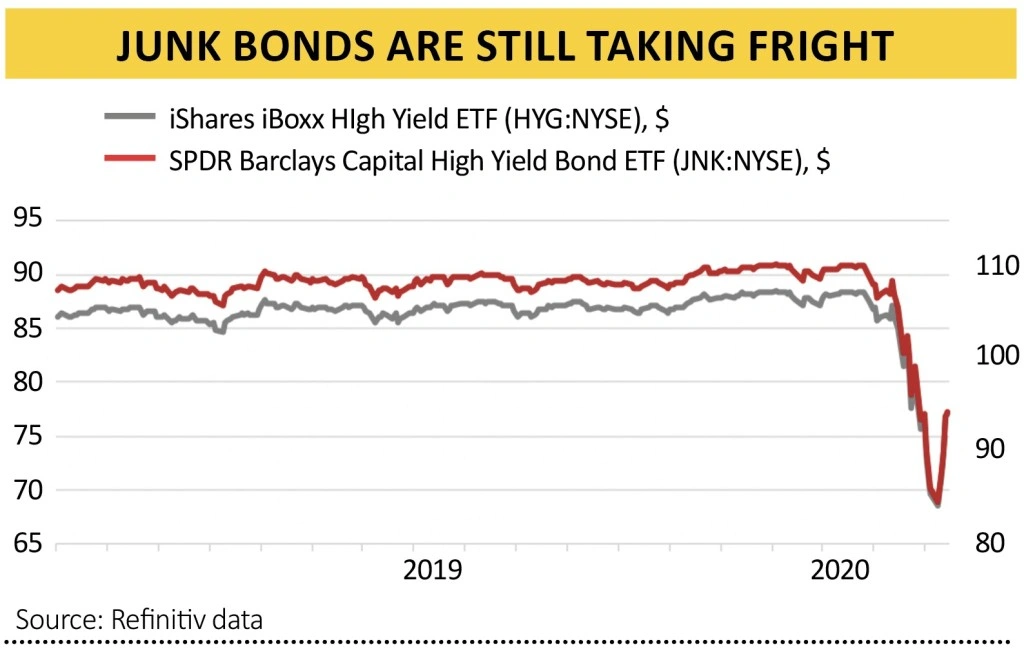
Junk bonds can be tracked quickly and easy – for free – via the price of two US-quoted exchange-traded funds, iShares iBoxx $ High Yield Corporate Bond and SPDR Barclays Capital High Yield Bond ETF, which glory in the respective tickers HYG and JNK.
Both are trying to recover lost ground. If they can do so under their own steam, without central bank interference, that could perhaps be a sign that markets are starting to think we are coming out of the other side of the crisis.
Once upward momentum is established in any or all of these charts, investors need to see a break in the classic bear market trend of a series of lower highs and lower lows.
Failure to make, or hold, a new peak can often see markets subside to a new trough as they grind lower. Applying that maxim to the FTSE 100, the index ideally needs to get back to 9 March’s 5,966 threshold before then making an assault on 6 March’s 6,463.
Sixth sense
Perhaps the most reliable sign of a market bottom is the least tangible of all. This is this author’s fifth major bear market, after 1990-92, 1998, 2000-03 and 2007-09. With the benefit of hindsight, the biggest buy signal of all was the absence of people asking whether it was time to buy, as this signified total capitulation.
Investors can use their own judgement as to whether we are at the point where the towels are being throw in or not.
Important information:
These articles are provided by Shares magazine which is published by AJ Bell Media, a part of AJ Bell. Shares is not written by AJ Bell.
Shares is provided for your general information and use and is not a personal recommendation to invest. It is not intended to be relied upon by you in making or not making any investment decisions. The investments referred to in these articles will not be suitable for all investors. If in doubt please seek appropriate independent financial advice.
Investors acting on the information in these articles do so at their own risk and AJ Bell Media and its staff do not accept liability for losses suffered by investors as a result of their investment decisions.
Issue contents
Feature
First-time Investor
Great Ideas
Investment Trusts
News
- Market mood lifted by huge financial support but investors remain wary
- Why oil prices have plunged to 18-year lows
- Housing market goes into coronavirus hibernation
- Bill Ackman sets record straight after $2.6bn win
- Temple Bar dumps holdings after share price collapse
- Byotrol steps up in the fight against coronavirus
- Have capital preservation funds lived up to their name?