Archived article
Please note that tax, investment, pension and ISA rules can change and the information and any views contained in this article may now be inaccurate.
 magazine
Do markets need to care about who is the next US president?
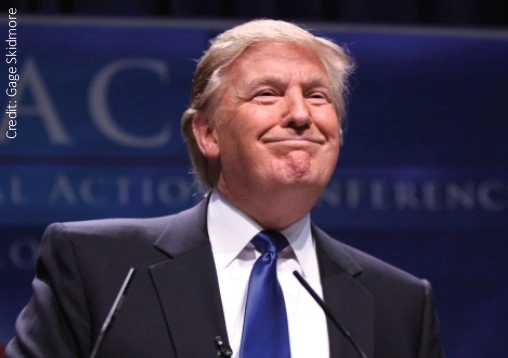
Despite the best efforts of the Democratic Party, it still seems unlikely that US president Donald J. Trump will be impeached, not least because the Republicans have a blocking majority in the Senate, the upper house of Congress.
But Trump could still be unseated on 3 November, when Americans will get to vote for who will be president, as well as all 435 members of the lower House of Representatives and 34 of the 100 members of the Senate, or at least by 14 December when then electoral colleges meet.
The race to the White House kicks off in earnest next week, on Monday 3 February, when Republican and Democrat party members start to vote for their preferred candidates.
Iowa will be the first state to express a preference and candidates will be hoping to build up steam here and then move on to New Hampshire (11 Feb) and Nevada (22 Feb) so they can really stake their claim after Super Tuesday (3 Mar) when no fewer than 15 states will hold their so-called primaries.
Assuming he does duck the indignity of impeachment, president Trump will face what looks like token opposition from three rivals. The real interest lies in who will win the Democrats’ race, where Joe Biden, Bernie Sanders, Elizabeth Warren, Pete Buttigieg and Michael Bloomberg appear to be the leading contenders.
Trump will be looking to avoid becoming only the third one-term president since 1945 and victory is not certain. Hillary Clinton actually won more votes than Trump, but the Republican won more votes from the electoral colleges who make the ultimate decision. All it could take is for Michigan, Wisconsin and Pennsylvania to go back to the Democrats for their chosen candidate to prevail.
The race is on
It may not just be president Trump who gets an attack of nerves as the race becomes more intense.
Data that stretches back to Harry S. Truman shows that the US stock market, as benchmarked by the Dow Jones Industrials, fares less well on average in the final year of a presidential term, especially if the incumbent is a Republican.
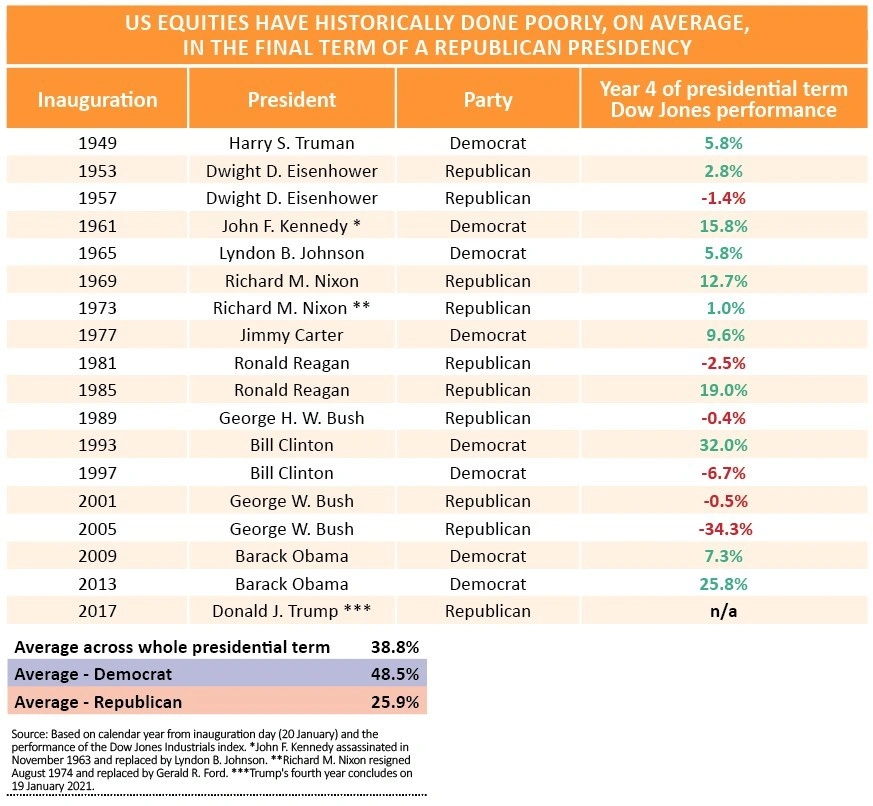
This may reflect nothing more than markets’ fears of any swing to the left under the Democrats. However, investors will see from the data that the Dow Jones has tended to do better under them than under the Grand Old Party.
Nor should they forget that Trump was perceived as a risk to markets before his election in 2016, thanks in particular to his policies on trade and international relations.
As such it may not pay to get too caught up in the identity of the winner of the party races (which will conclude in July in Milwaukee, Wisconsin for the Democrats and in August in Charlotte, North Carolina for the Republicans) especially as other factors will continue to influence how US equities perform.
The economy, stupid
Federal Reserve policy is one huge factor here and the central bank is independent – although some may be tempted to argue that it caved into presidential pressure when it pushed through three interest rate cuts in 2019.

In addition, corporate profits and especially cash flows drive equity valuations over the long term and they are largely (if not exclusively) the result of the broader economic cycle.
Going back to the data, the impact of the wider macro backdrop upon US equity market performance seems pretty clear, even investors are prepared to give credit to Ronald Reagan for the reforms he initiated to drag the US out of the mire in the early 1980s or even Trump for his 2017 tax cuts.
The recessions of 1948-49, 1954-55, 1957-58 and 1960-61 did not unduly harm stock market performance under Truman, Eisenhower, Kennedy and Johnson but the Dow Jones sagged during the 1970-71 and 1973-75 downturns during the Nixon/Ford years.
George W. Bush had nothing to do with the tech bust at the turn of the millennium or the collapse of the US housing market but the recessions of 2001 and 2008-09 mean that the Dow did badly across both of his terms.
Equally, thumping economic booms in the 1950s and 1980s and the recovery from the 2007-09 (helped by Fed largesse) mean the stock market performance numbers under Truman, Eisenhower, Obama and Trump look very good.
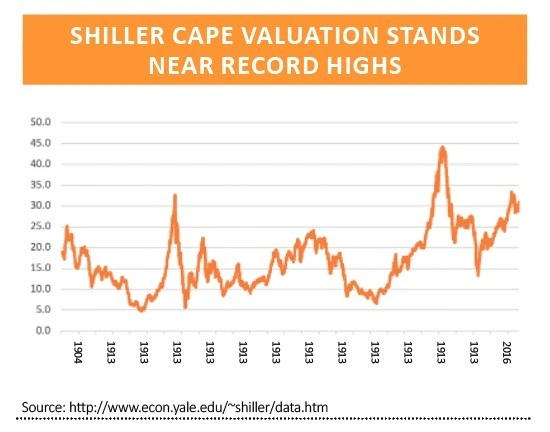
Cape fear
Investors must also account for equity valuations. Using Professor Robert Shiller’s cyclically-adjusted price-to-earnings (CAPE) ratio as a benchmark, the S&P was trading on historically lowly valuations in 1949 and 1953 when Truman and Eisenhower took office, while the ravages of inflation in the 1970s meant that the valuations were rock bottom when Reagan took over in the early 1980s.
That created plenty of potential for upside and the same could be said of when Obama became president in January 2009 just as the financial crisis was abating and a bear market had wreaked havoc.
By contrast, George W. Bush came to power just as the tech bubble had driven valuations that made even the dizzying (and disastrous) heights of 1929 seem modest.
In his case, almost the only way was down and with the Shiller CAPE multiple back near historic highs, the next president and investors could be forgiven for wondering what may come next (although a real melt-up can still be justified by those bold enough to point to the 2000 peak valuation).

Important information:
These articles are provided by Shares magazine which is published by AJ Bell Media, a part of AJ Bell. Shares is not written by AJ Bell.
Shares is provided for your general information and use and is not a personal recommendation to invest. It is not intended to be relied upon by you in making or not making any investment decisions. The investments referred to in these articles will not be suitable for all investors. If in doubt please seek appropriate independent financial advice.
Investors acting on the information in these articles do so at their own risk and AJ Bell Media and its staff do not accept liability for losses suffered by investors as a result of their investment decisions.