Archived article
Please note that tax, investment, pension and ISA rules can change and the information and any views contained in this article may now be inaccurate.
 magazine
Using the Portfolio X-Ray tool to better understand your investments

A reader has asked if we could explain how to interpret the information from Morningstar’s Portfolio X-Ray tool used on AJ Bell Youinvest’s website and available from Morningstar directly.
This article offers our thoughts on the usefulness, strengths and weaknesses of the tool. We have also created a randomly selected mock portfolio to illustrate the discussion.
DIVERSIFICATION
The first page of the Portfolio X-Ray report addresses portfolio diversification and slices your holdings into different assets such as stocks, bonds and cash, as well as countries, sectors and investment styles.

Diversification is about spreading your investments into assets which have different risk and return profiles and smoothing your portfolio returns.
Owning both BP (BP.) and Royal Dutch Shell (RDSB), for example, just increases your exposure to the same factors, which is great when things are going well in the oil sector, but potentially disastrous when things turn ugly.
The highest level involves looking at different assets types, such as stocks, which are very risky, cash which is virtually risk free, and fixed interest investments or bonds which are somewhere in between stocks and cash on the risk ladder.
Each investor’s risk appetite, age and current financial health will determine their most appropriate investment exposure. Our mock portfolio has a heavy weighting (87%) in equities, almost half of which are in the UK and another 22% in the US. Asia comes in at around a quarter of the portfolio. This means our portfolio’s risk is relatively high.
In times of market stress we should expect our portfolio to underperform a more balanced portfolio and even lose money if markets go south.
It is worth noting that the mock portfolio holds investment trusts and the Portfolio X-Ray tool has taken the individual holdings in each product into account when calculating country exposures.
We will look at the risk side of things later in the article.
SECTORS
Drilling down to individual stocks within the equity portion of our portfolio, the X-Ray tool analyses the types of stock held and sector breakdown. The report divides the portfolio into Cyclical, Sensitive and Defensive.
What this attempts to do is categorise stocks according to how correlated or sensitive they are to the business cycle. Cyclical stocks such as housebuilders are highly sensitive to the economy, while Defensives such as utilities are not very sensitive. Stocks deemed Sensitive, such as industrial companies, are somewhere in between.
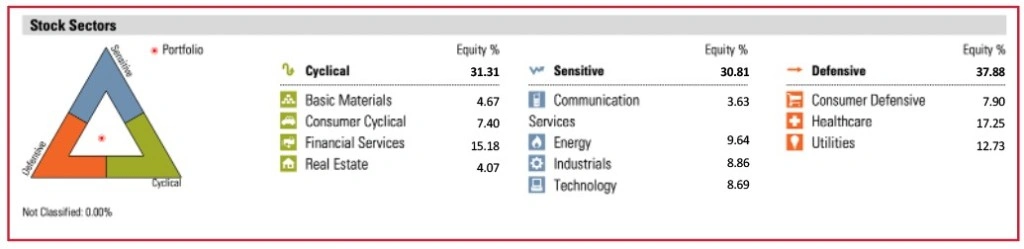
Given that most people haven’t a clue whether the economy will be expanding or contracting next year, it’s best to spread investments across all three categories, as our mock portfolio has done with roughly 33% in each.
INVESTMENT STYLES
Investment styles such as value, growth and size tend to come in and out of favour as the economy expands and contracts and therefore it is worth spreading exposure across different investment styles. Over-exposure to a single factor will impact the performance of your overall portfolio and make the returns more volatile.

Our portfolio is tilted towards large caps (76%) and value (40%) but it also has 37% in stocks which are considered a blend of value and growth companies. If small cap growth investing came into vogue our portfolio might suffer poor performance as it only has 2% in that style.
PERFORMANCE AND RISK
It’s always useful to see how your portfolio has performed and not just in isolation, but against an appropriate benchmark.
It should be remembered that investing is a long-term activity and therefore it makes more sense to focus on the three and five year returns rather than the ‘noisy’ shorter-term numbers.
You can see from the report how you performed in absolute terms and relative to a benchmark. The ‘+/- Benchmark’ figure is the amount by which you have outperformed or underperformed, not the actual benchmark performance figure.
HOW MUCH RISK DID YOU TAKE TO GET YOUR RETURN?
The finance industry has adopted standard deviation as the way to measure risk. This simply measures how much the value of your portfolio ‘moves around’. For example, in the unlikely case of your portfolio delivering 5% every year, with no exceptions, the standard deviation would be zero. Here, in this context, less is more.

The Sharpe ratio incorporates the standard deviation to calculate a risk-adjusted return and is considered a better measure of success. The higher the figure the better and any value greater than one is considered good. Two is very good and three is excellent.

Important information:
These articles are provided by Shares magazine which is published by AJ Bell Media, a part of AJ Bell. Shares is not written by AJ Bell.
Shares is provided for your general information and use and is not a personal recommendation to invest. It is not intended to be relied upon by you in making or not making any investment decisions. The investments referred to in these articles will not be suitable for all investors. If in doubt please seek appropriate independent financial advice.
Investors acting on the information in these articles do so at their own risk and AJ Bell Media and its staff do not accept liability for losses suffered by investors as a result of their investment decisions.