- Banks’ share prices have started to slip on both sides of the Atlantic
- Analysts still expect record bank profits from the Big Five FTSE 100 lenders in 2026, 2027 and 2028
- Dividends and buybacks remain generous
- Barclays is the first FTSE 100 bank to report Q3 results this Thursday
- Valuations are less attractive than they once were after a storming run for banks’ share prices this decade
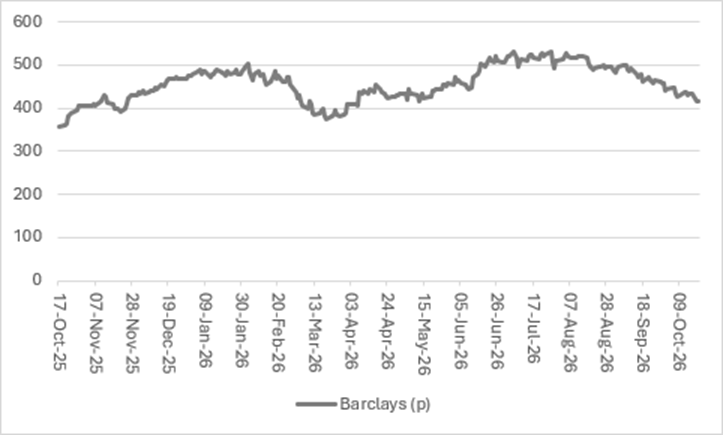
“Barclays is the first of the Big Five FTSE 100 banks to report its third-quarter results on Thursday, and a summertime slump in its share price suggests that things maybe cannot get much better from here – even if analysts expect record profits across the quintet in each of 2026, 2027 and 2028, along with bumper dividends and share buybacks,” says AJ Bell investment director Russ Mould.
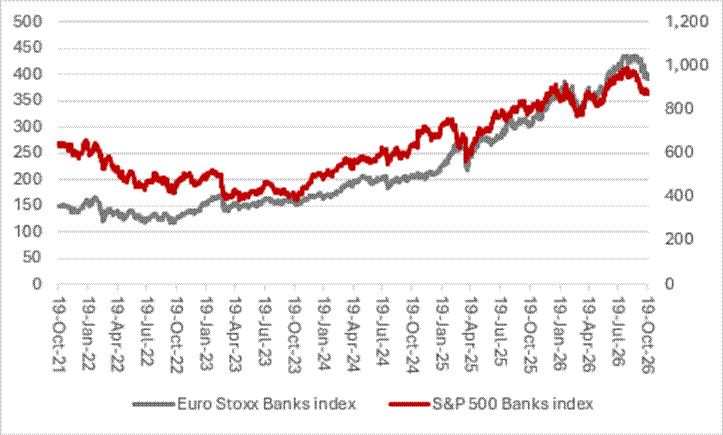
“Worries about windfall taxes may be one concern, but banks’ shares are sliding in the US and Europe too, after a storming run this decade. Wider concerns could also be weighing on shares, such as loan book exposure to private credit and artificial intelligence specialists, as well as the possible impact of higher interest rates on demand for credit, net interest margins and maybe even increases in provisions for sour loans.
Source: LSEG Refinitiv data.
“Barclays is first out of the blocks, followed by HSBC, Standard Chartered, Lloyds and NatWest on 27, 28, 29 and 30 October respectively.
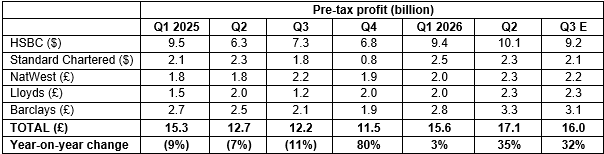
“The numbers should be strong, as analysts are looking for combined pre-tax income across the five to comfortably exceed the levels attained between July and September in 2025, even if some of that increase will be down to the base effect caused by car finance compensation charges at Lloyds and Barclays, and Barclays swallowing a £110 million hit a year ago from the failed Tricolor auto subprime lender in the USA.
Source: Company accounts, Marketscreener, analysts’ consensus forecasts.
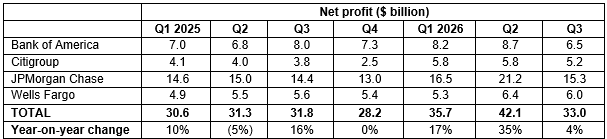
“A one-third year-on-year increase would, at face value, be hard to sniff at, especially as the US megabanks showed a slowdown and generally undershot expectations with their third-quarter results released earlier this month.
Source: Company accounts.
“Equally, that more nuanced picture for the third quarter did not help the US banks’ share prices capture any fresh upward momentum, and analysts will focus on quality as well as quantity when it comes to the latest earnings statements from the FTSE 100’s Big Five.
Source: LSEG Refinitiv data.
“When they assess the third-quarter figures, analysts will look to five sets of data in particular.
“The first is loan and deposit growth, where there have been clear signs of acceleration. This could be a good sign, as it may mean the wider economy is picking up steam, although it may also mean bankers are getting overconfident and easing their standards, something that can point to a peak in economic and stock market cycles.
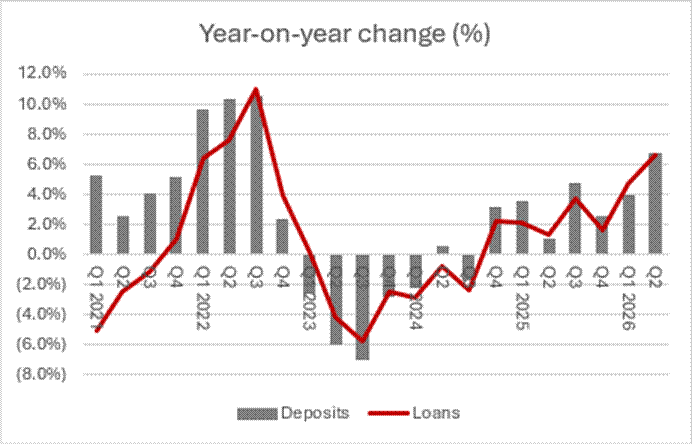
Source: Company accounts, for Barclays, HSBC, Lloyds, NatWest, and Standard Chartered in aggregate, in sterling terms.
“Helped by those trends, net interest income and net interest margins have continued to blossom.
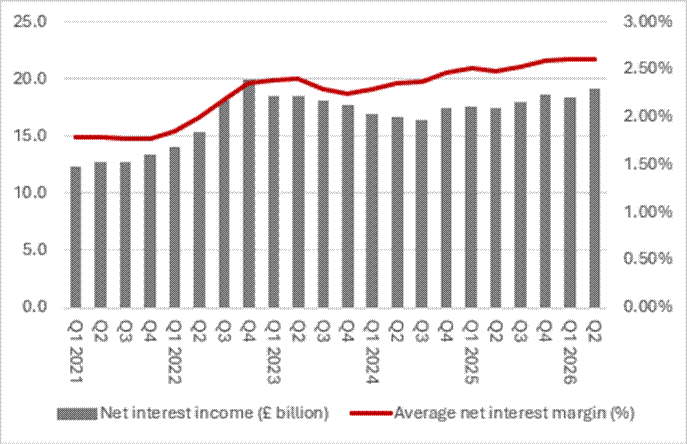
Source: Company accounts, for Barclays, HSBC, Lloyds, NatWest, and Standard Chartered in aggregate, in sterling terms.
“Despite Barclays’ misadventures with both Tricolor and UK property lender Mortgage Financial Solutions, loan impairments remain relatively modest, although they are slowly creeping up and shareholders will not want to see any marked increases here. The same can be said for litigation and conduct costs, which have fallen a lot in 2026 after the costs taken in relation to discretionary commission agreements on car loans in the UK in 2024 and 2025 at Barclays and particularly Lloyds.
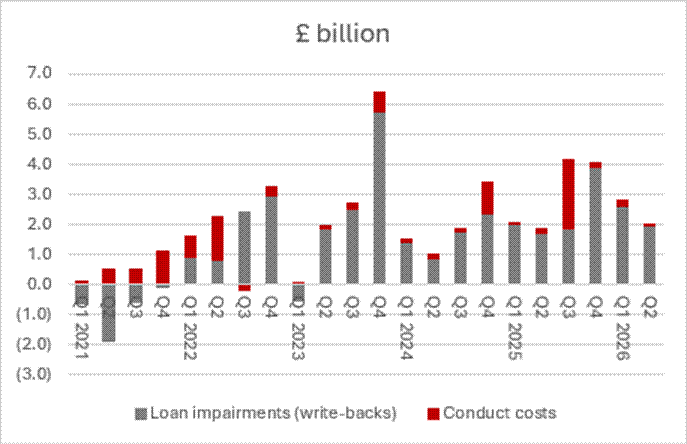
Source: Company accounts, for Barclays, HSBC, Lloyds, NatWest, and Standard Chartered in aggregate, in sterling terms.
“The investment bank is always a focus of investor attention at Barclays and by rights the operation should still be coining it, given the prevailing volatility in equity, bond, currency and commodity markets, as well as ongoing merger and acquisition activity, even if new stock market listings remain relatively rare.
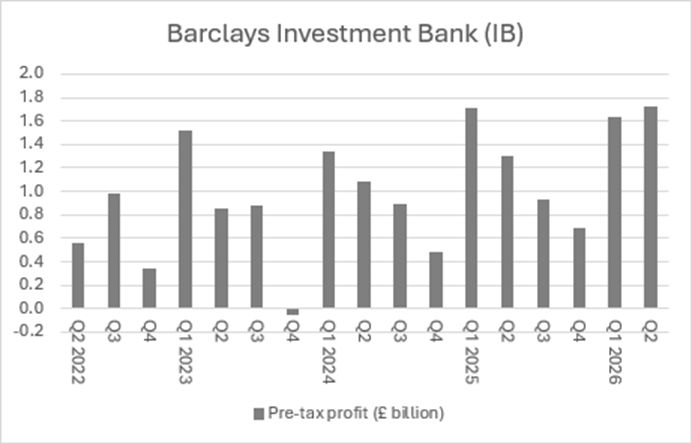
Source: Company accounts.
“Attention will then shift to cash returns.
“NatWest has put its buybacks on hold as it digests the £2.7 billion purchase of Evelyn Partners, but the other four are all using this mechanism, with HSBC having restarted buybacks in this third quarter after a pause as it focused on integrating its $13.6 billion purchase of the stake in Hong Kong’s Hang Seng Bank that it did not already own.
“These buybacks, and forecasts for bumper dividends, may weaken the banks’ case that any windfall taxes or higher levies will damage their ability to lend and contribute to economic growth, as this is in effect capital they are saying they do not need.
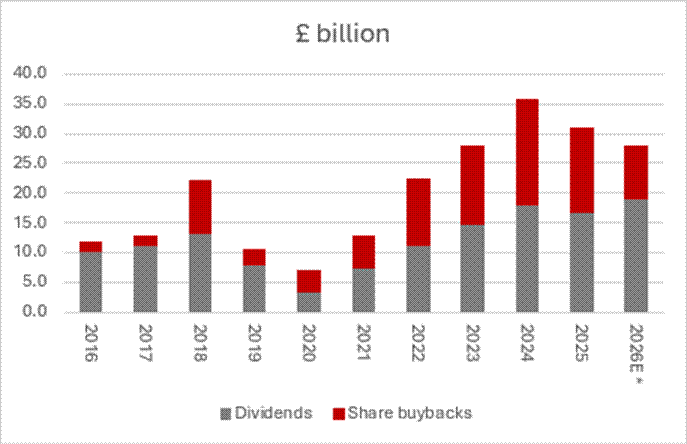
Source: Company accounts for Barclays, HSBC, Lloyds, NatWest, and Standard Chartered in aggregate in sterling terms, Marketscreener, consensus analysts’ forecasts. *Buybacks as announced to the end of Q3 2026.
“Chancellor Healey will get his chance to have a say on that in the Budget on 28 October, and the issue of windfall taxes is one potential cloud for the sector. Again, however, banks’ shares are retreating in the US and Europe too, so there may be other factors at work.
“One could be valuation. After a stunning run from the post-Covid lows, when UK bank stocks were all trading on hefty discounts to tangible net asset value per share, the Big Five all now trade at, or around, one times tangible book value. Barclays is the closest to one times tangible book value after its summertime falls.
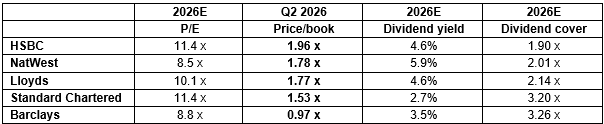
Source: Company accounts, Marketscreener, consensus analysts’ forecasts, LSEG Refinitiv data.
“Higher share prices also mean that the banks’ dividend yields and total cash yields, including buybacks, look a little less compelling relative to benchmark 10-year gilt yields, especially as the risk-free rate now stands at 5.44%. That is just a fraction below the total cash yield on offer from the Big Five, so the huge premium offered by the lenders for much of this decade is largely gone.”
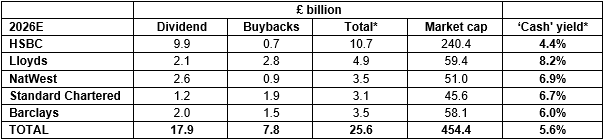
Source: Company accounts, Marketscreener, consensus analysts’ forecasts, LSEG Refinitiv data. *Dividends plus buybacks. Buybacks as announced to the end of Q3 2026.
Russ Mould
Investment Director
Russ Mould’s long experience of the capital markets began in 1991 when he became a Fund Manager at a leading provider of life insurance, pensions and asset management services. In 1993, he joined a prestigious investment bank, working as an Equity Analyst covering the technology sector for 12 years. Russ eventually joined Shares magazine in November 2005 as Technology Correspondent and became Editor of the magazine in July 2008. Following the acquisition of Shares' parent company, MSM Media, by AJ Bell Group, he was appointed as AJ Bell’s Investment Director in summer 2013.
Contact details
Mobile: 07710 356 331
Email: russ.mould@ajbell.co.uk